A secret pattern in Bitcoin no one told you
After this, you'll understand how Bitcoin moves and which is the next price

Welcome to Top Chart Patterns! 👋
We’re always on the hunt for assets ready to make big moves in the coming weeks.
Our secret? We use proven, reliable chart patterns, found with advanced algorithms, to discover great opportunities. Then, we back up our picks with solid fundamental analysis to make sure each trade is built on a strong foundation.
Key Insights
In a hurry? Here’s what you need to know:
Critical Support: Bitcoin’s price often pivots sharply at $108,000, supported by massive accumulation and historic bounces, if this level fails, history shows drops can accelerate quickly.
Learning to read the “invisible map” behind Bitcoin price moves turns confusion into clear opportunity. There is a hidden pattern that will blow your mind.
Mastering these patterns means no more trading blind, know where institutional money acts, and trade with confidence.
A secret pattern in Bitcoin no one told you
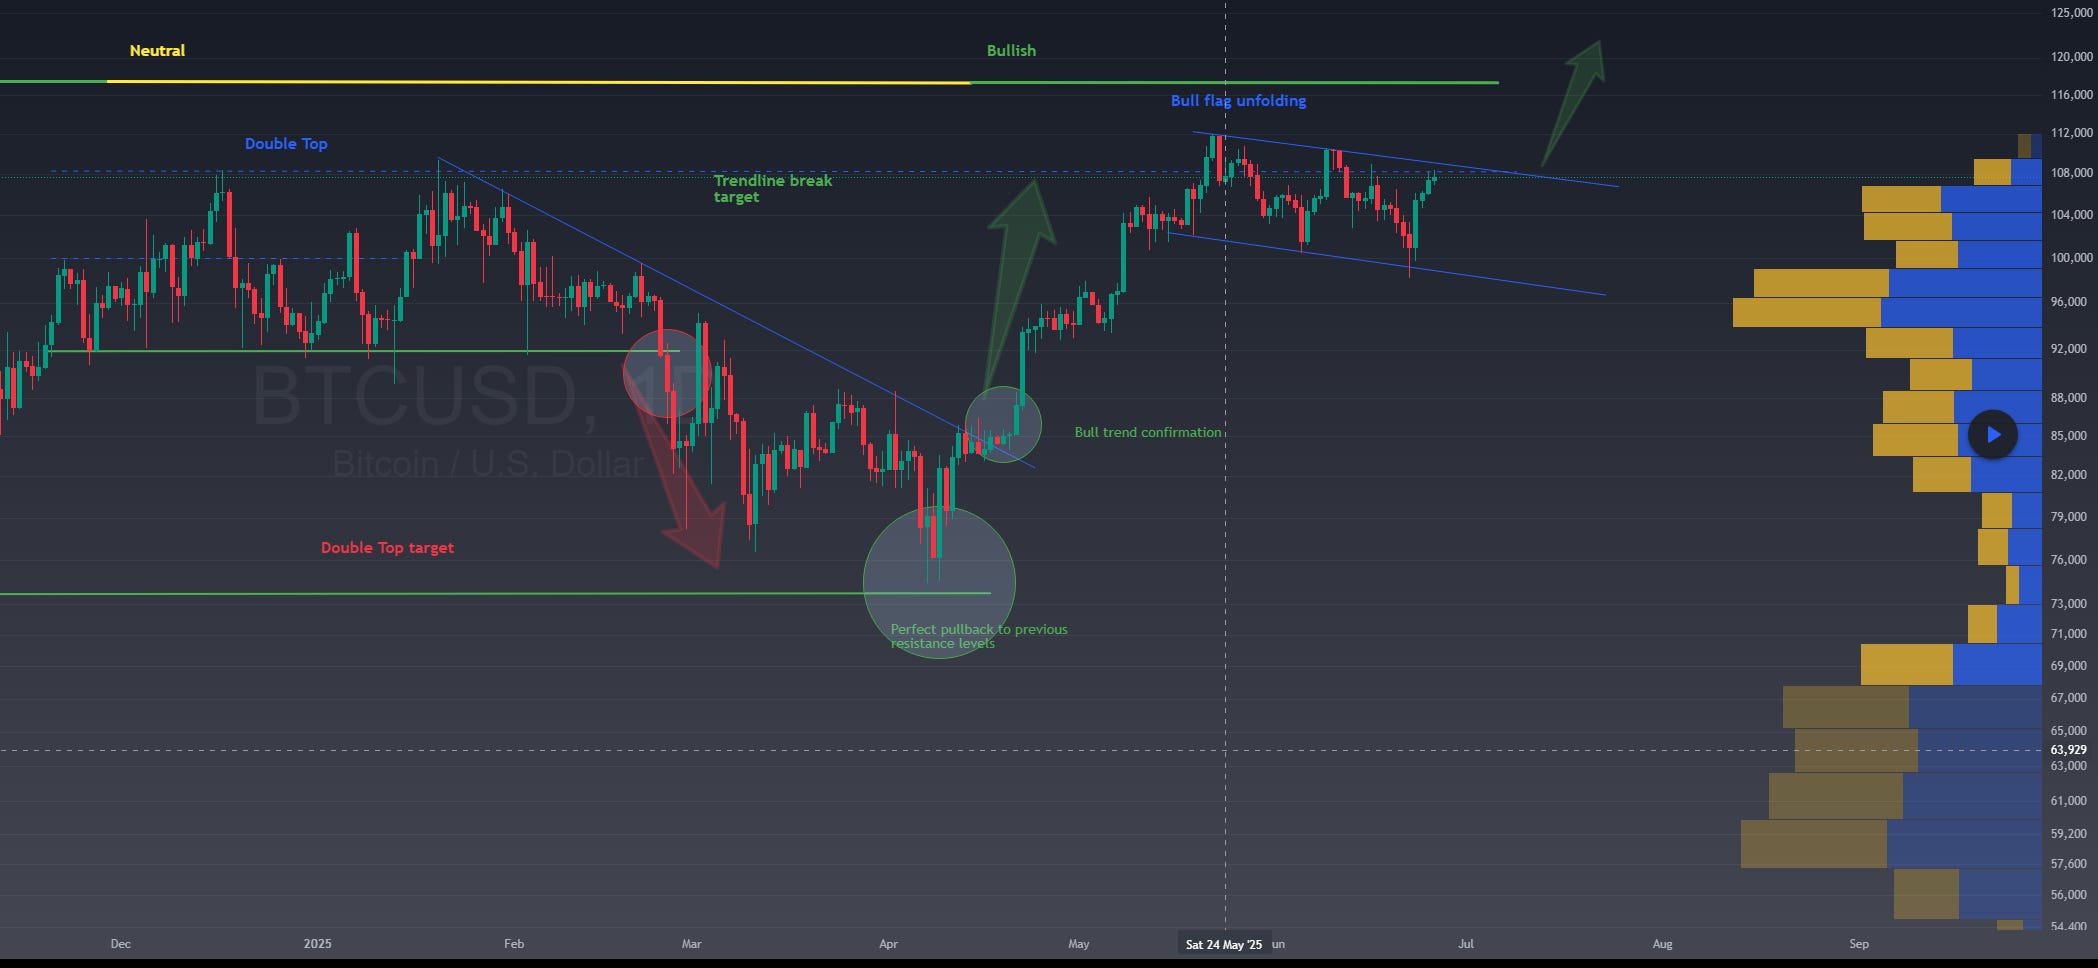
In my last idea, I mentioned that Bitcoin could be on the verge of starting its bearish phase if it loses the $108/110k zone. At the same time, several altcoins are showing patterns that could anticipate strong upward moves, so this scenario could fit perfectly.
But the key remains clear:
👉 Breaking down below $108k.
Everything else is secondary.
Why $108k?
Many of you have asked me:
"Why such an obsession with the $108k level? Isn’t it just another support?"
The truth is, it’s not just another support.
There are technical and statistical reasons why this level is so important. If it fails, the chances of a sharp drop in price increase dramatically. Historically, this level has been a turning point for Bitcoin many times.
For years, Bitcoin has seemed to follow a hidden pattern, moving in steps that very few traders notice, but those who do can take advantage of it in a very profitable way.
The 15% Secret 📊
Let me show you an example.
Why did I close my last idea near $120k instead of holding longer? Because I knew $124k was going to be a key level to sell, and I preferred to exit safely before it.
Here’s why.
When you map Bitcoin’s historical highs and lows, something fascinating appears:
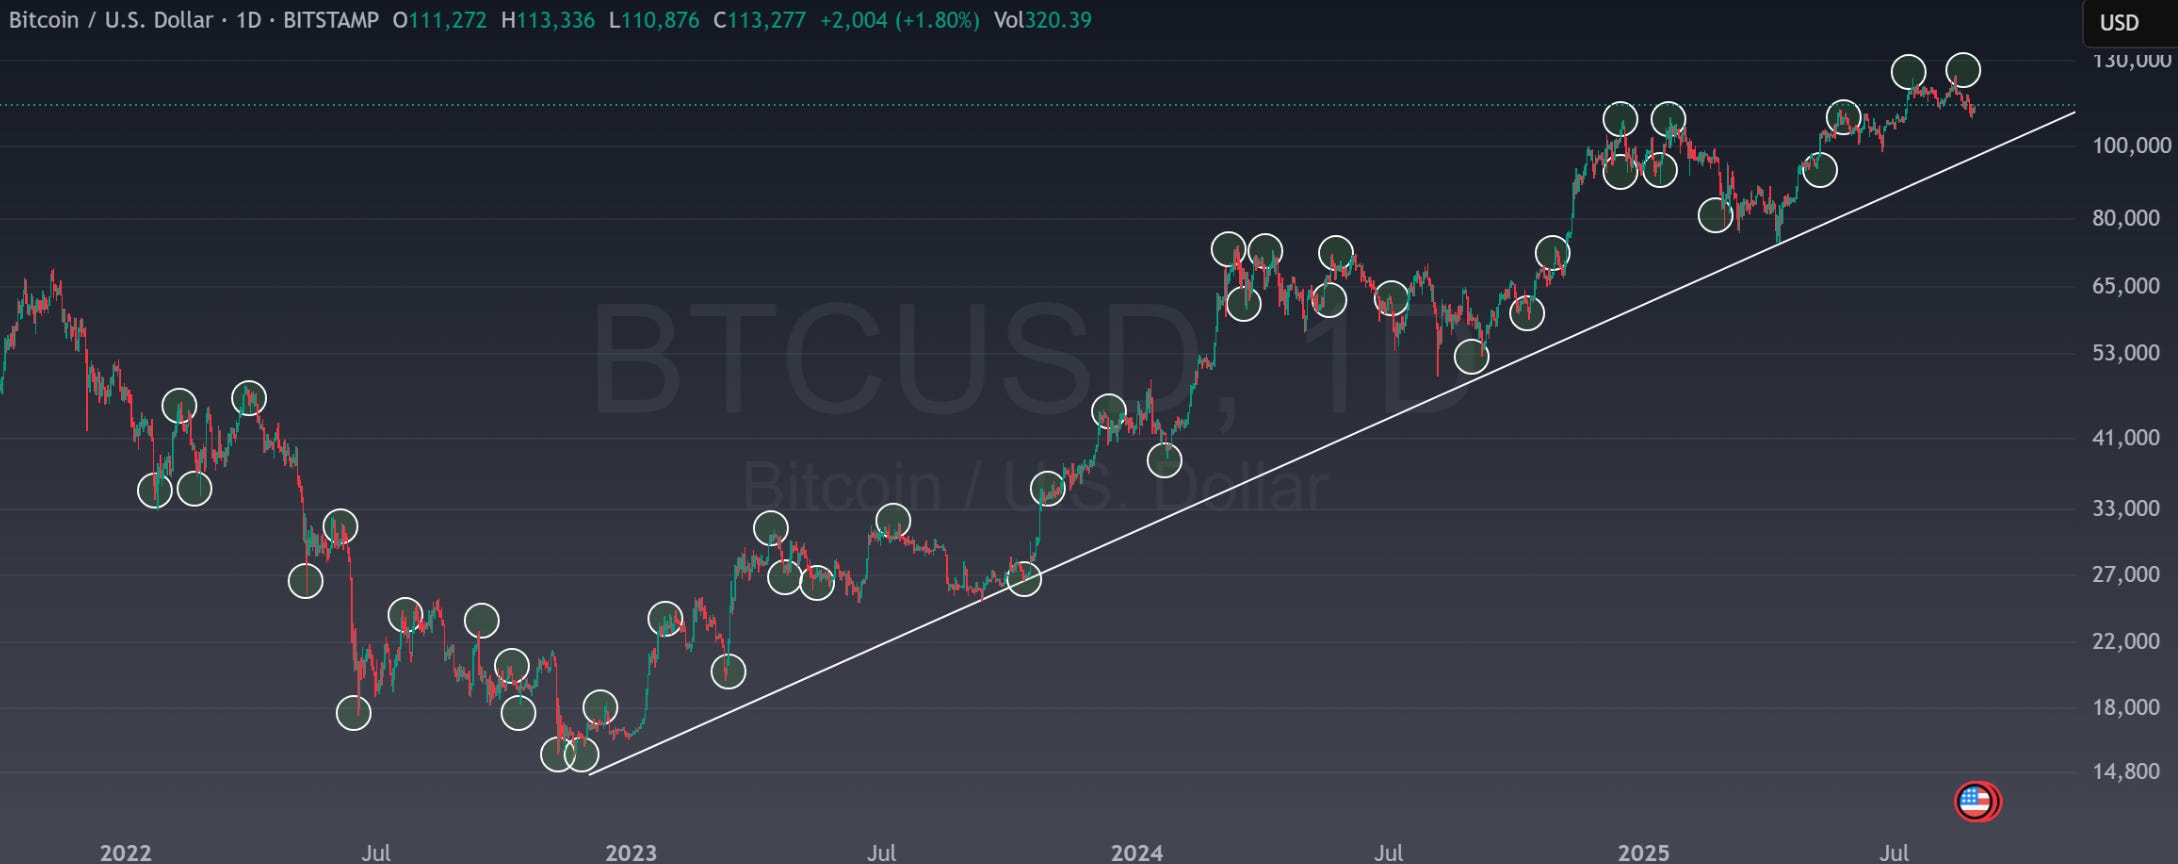
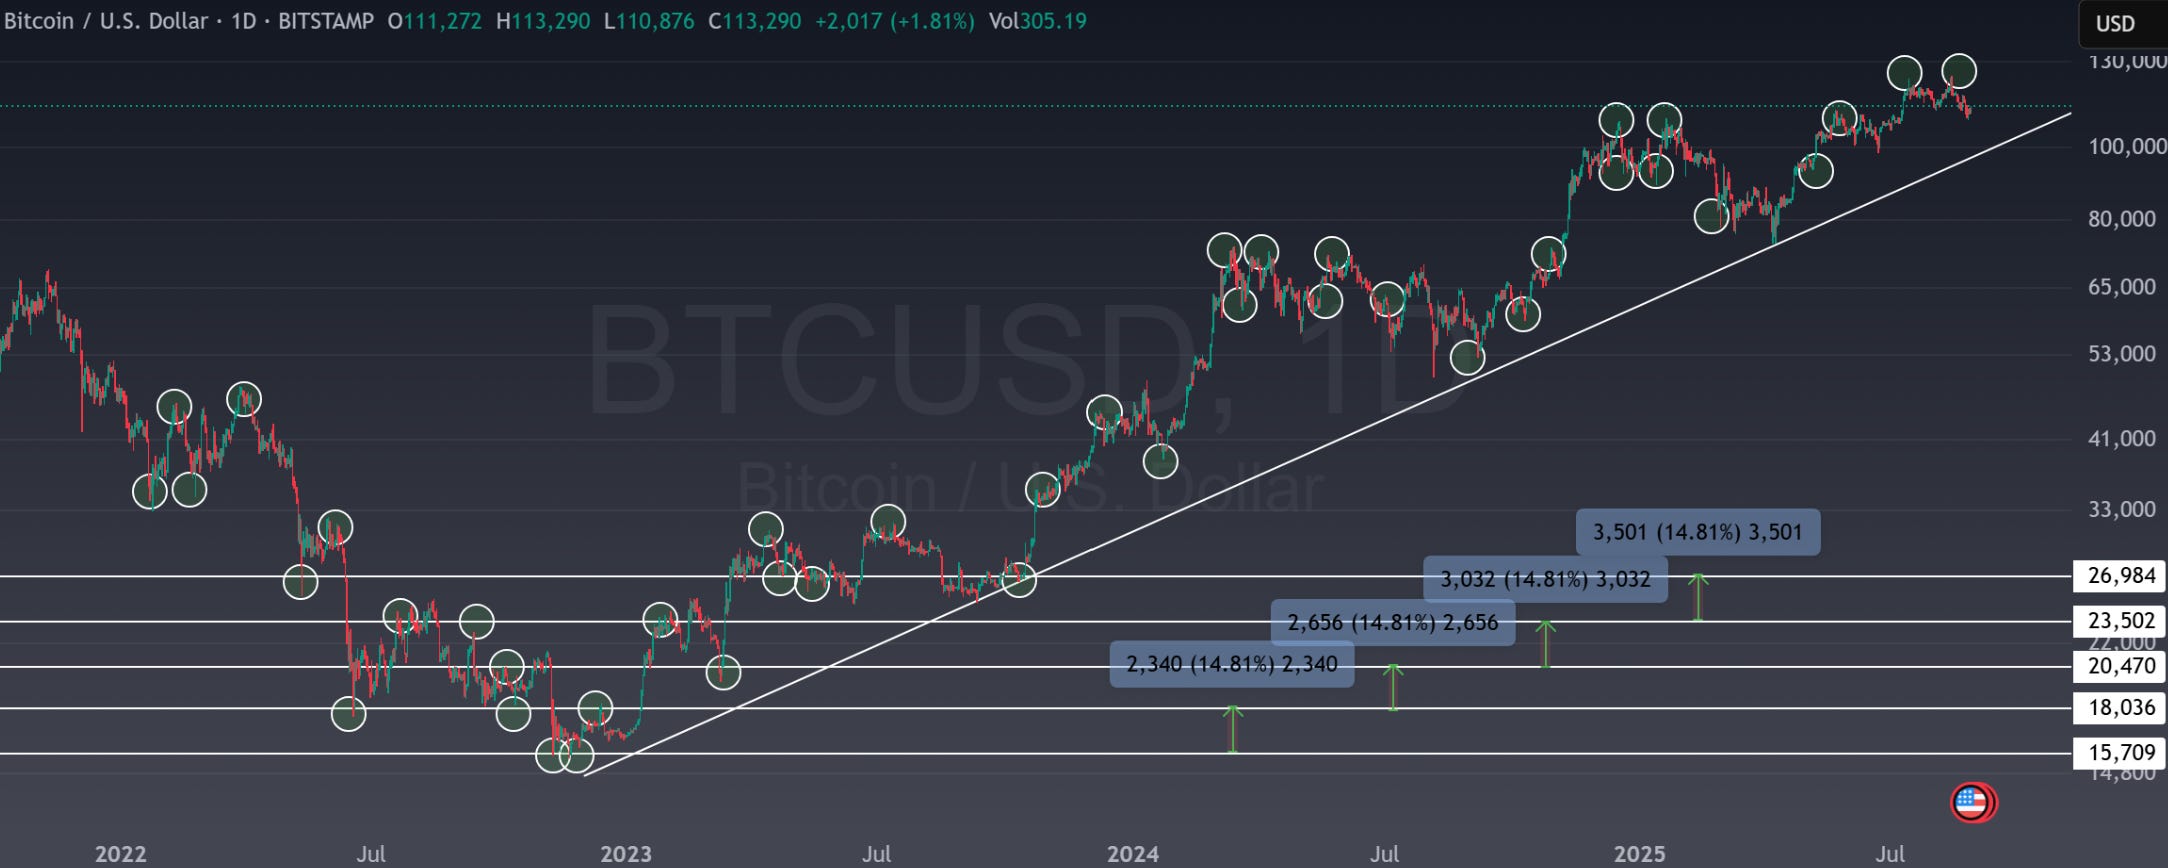
👉 Each support and resistance level is separated by roughly 15%.
Can you see the pattern?
It looks like chaos at first, but then you realize there’s an order inside the disorder. Every major bounce or rejection tends to happen right around these 15% intervals.
This is absolute art.
The price tends to rebound more along these lines than at any other levels, so the chances of a trend change or a rally starting here are much higher. The odds are completely in your favour if you know what’s happening.
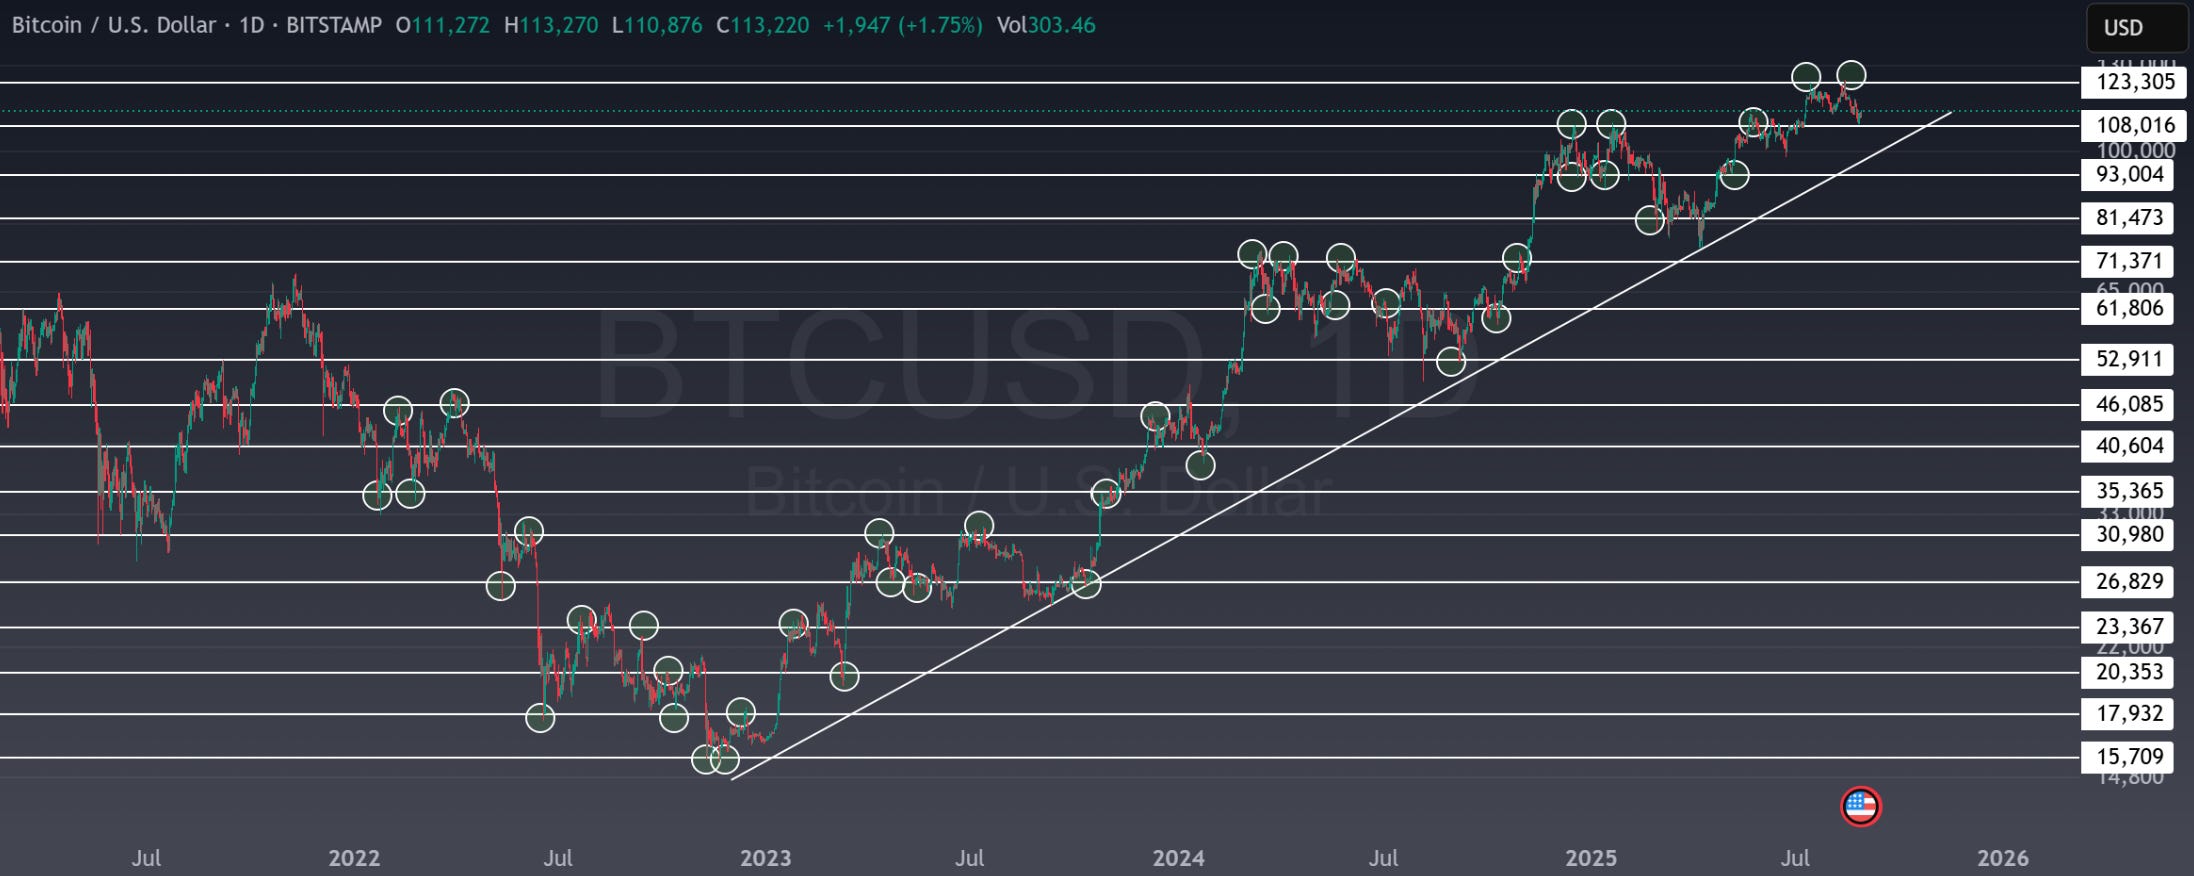
That’s why I knew $124k would be critical. And that’s why $108k is not “just another level.”
Ok good, but how do you profit from that?
If Bitcoin holds above $110k and pushes higher, the next relevant target is around $141k.
But if you’re looking for trades now, any long near the $108-110k area could offer a move back to $120k–$124k, giving you a potential reward of 4-5 times your risk if you keep your stop tight around $105k.
This is what makes trading exciting: once you identify the levels where institutions and algorithms are buying and selling, you stop trading blind.You stop standing in the middle of the storm, and instead, you learn to move with it.
✨ Final Thought
Every chart tells a story.
At first, it looks messy. But with the right perspective, patterns appear, and what seemed like noise turns into opportunity.
That’s the passion of trading, finding order in the chaos.
If you want to learn more about real investing, I would appreciate that you can spread the word and subscribe!
Thanks for reading, as a bonus, let me share some extra ideas in cryptos: