How Do I Determine if This Is the Top of the Market
When the climb is beautiful, we forget to check the horizon. Here is your map for the coming weeks.

Welcome to Top Chart Patterns. 👋
My process is simple: Filter the noise, find the signal.
Every week, I scan thousands of charts to isolate the top 1%, the rare setups showing genuine institutional footprints. I do the heavy lifting so you can focus on execution.
Results: Over 70% success rate with over +200% returns backed by strict risk management. All publicly audited on Tradingview.
How Do I Determine if This Is the Top of the Market
When the climb is beautiful, we forget to check the horizon. Here is your map for the coming weeks.
When everything is going well, nothing worries us.
The market climbs, we buy, we profit, and we repeat.
We haven’t faced a severe crisis in years, but history is a stern teacher: the American market has, in the past, spent entire decades without reaching a new high.
We must respect the market.
But respecting the market isn’t the same as fearing it.
Respecting it means pausing, looking around, and finding your bearings.
I like to think of it like a hike in the mountains. Just because the scenery is lush and the path is beautiful doesn’t mean you should stop checking your water supply, your food, or the clouds gathering on the horizon.
Today, I propose we do exactly that.
Amidst the current chaos, BTC falling relentlessly, Gold and Silver behaving like meme coins, and the US Tech sector losing key levels, we must ask the vital question:
When will it be time to sell the major indices?
The US Landscape
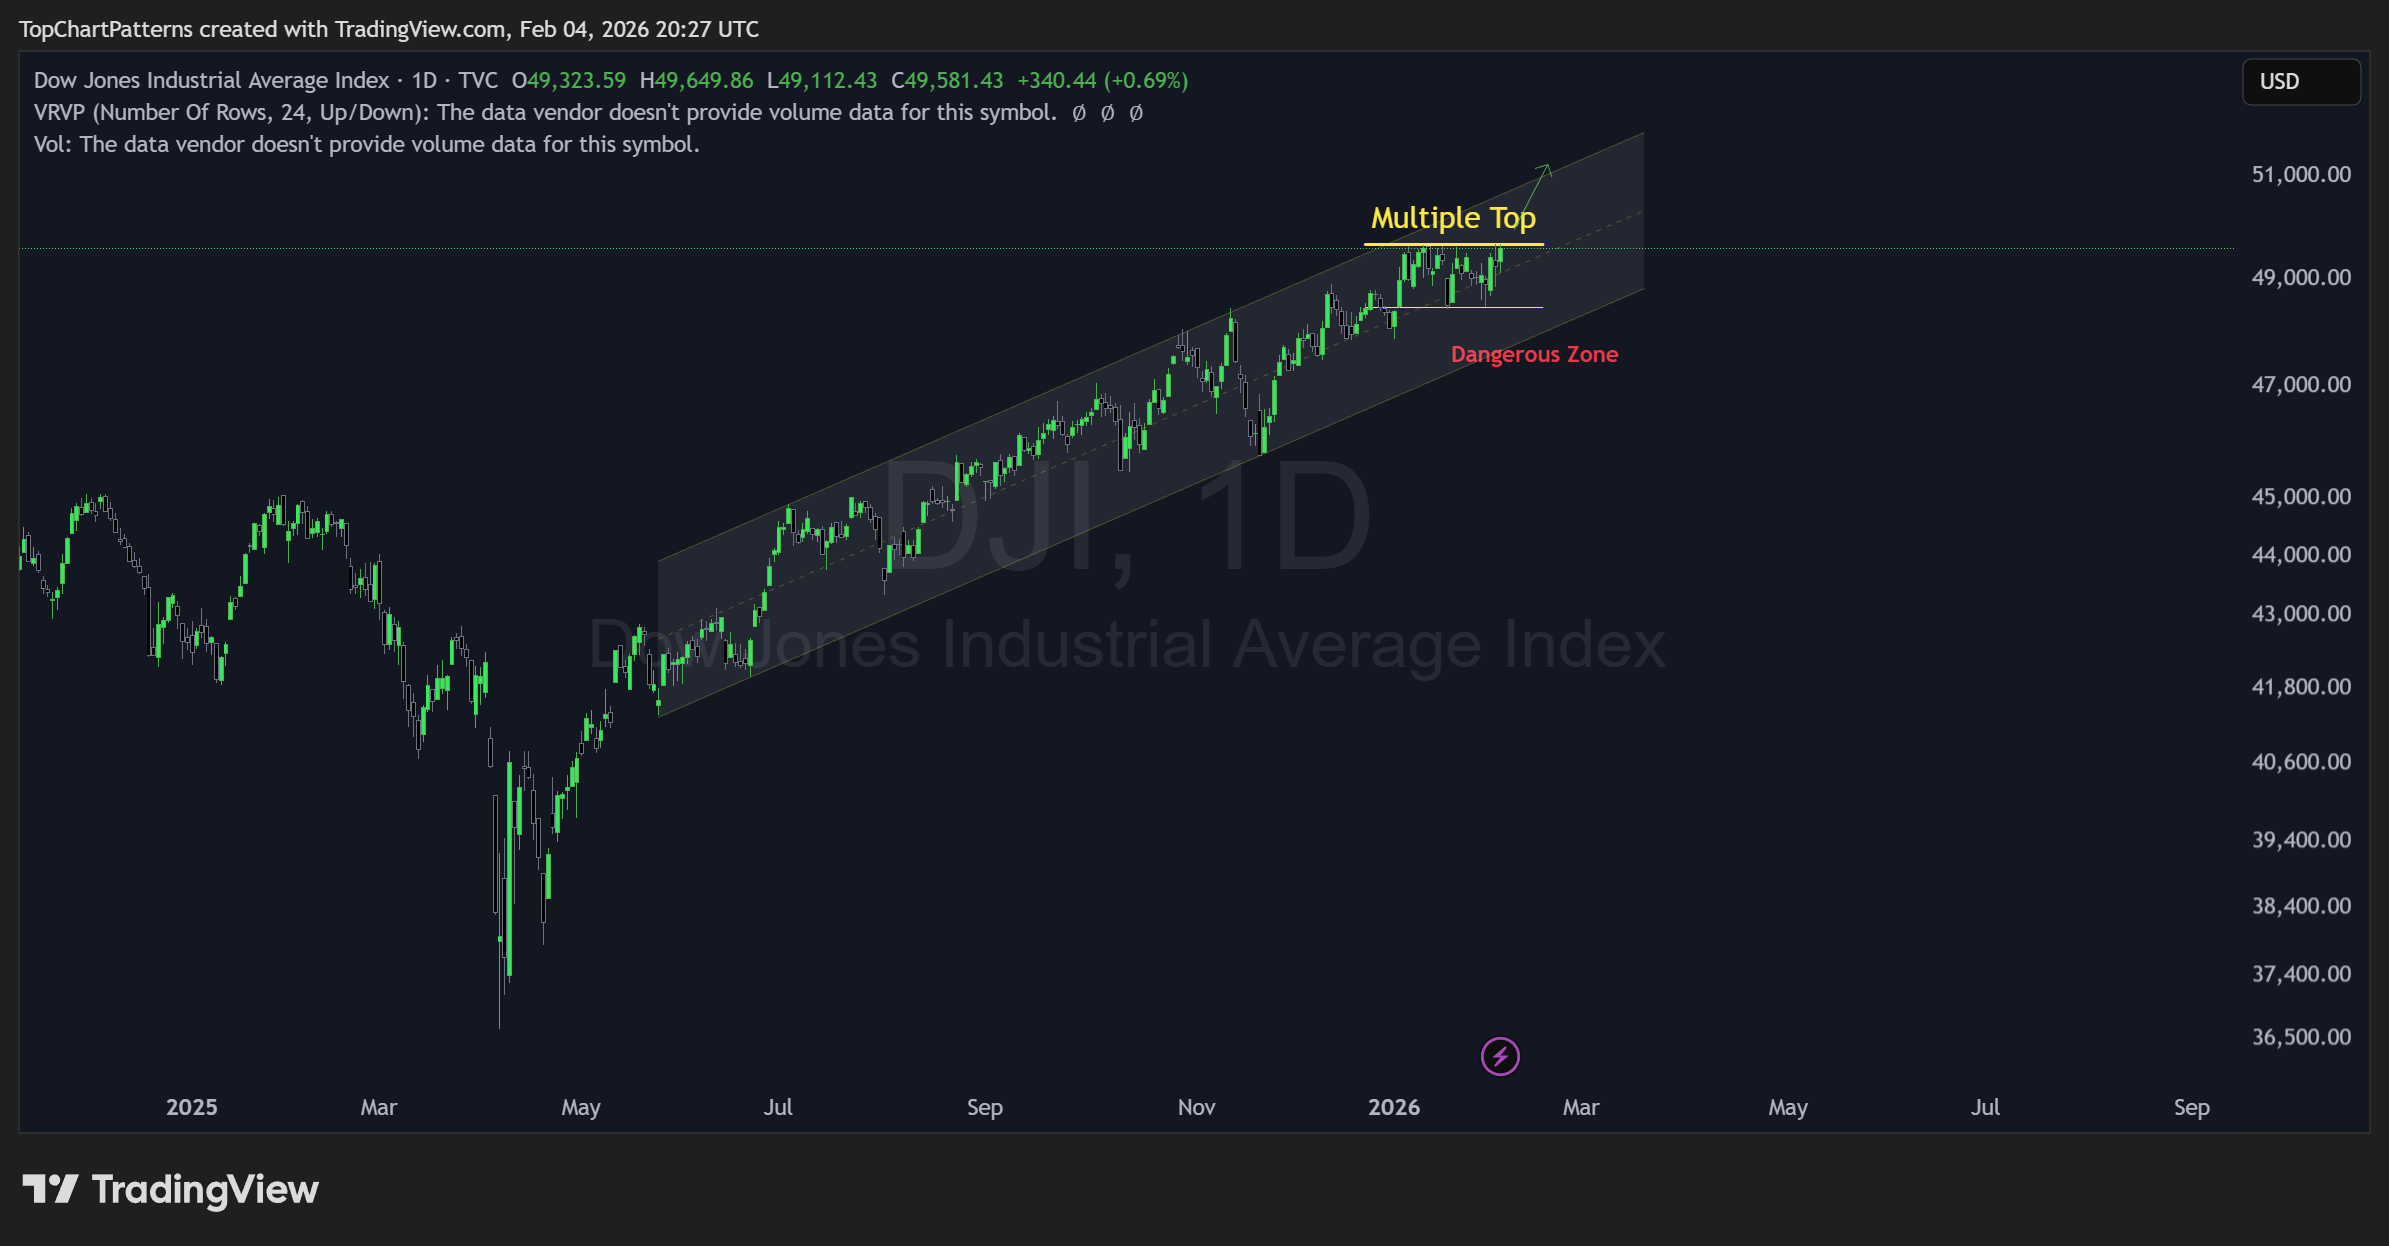
1. Dow Jones Industrial Average (DJI)
The Dow has been riding a bullish channel for a year. As long as it stays within this channel (or breaks higher), it remains a clear “buy.” We are currently seeing a Multiple Top, a breakout here would likely trigger another major rally.
The Warning Sign: Watch for a drop to $48,200, which would activate a double top to the downside.
The Line in the Sand: $47,700. Below this, we lose major support and the bullish channel.
For now, the bias remains up.
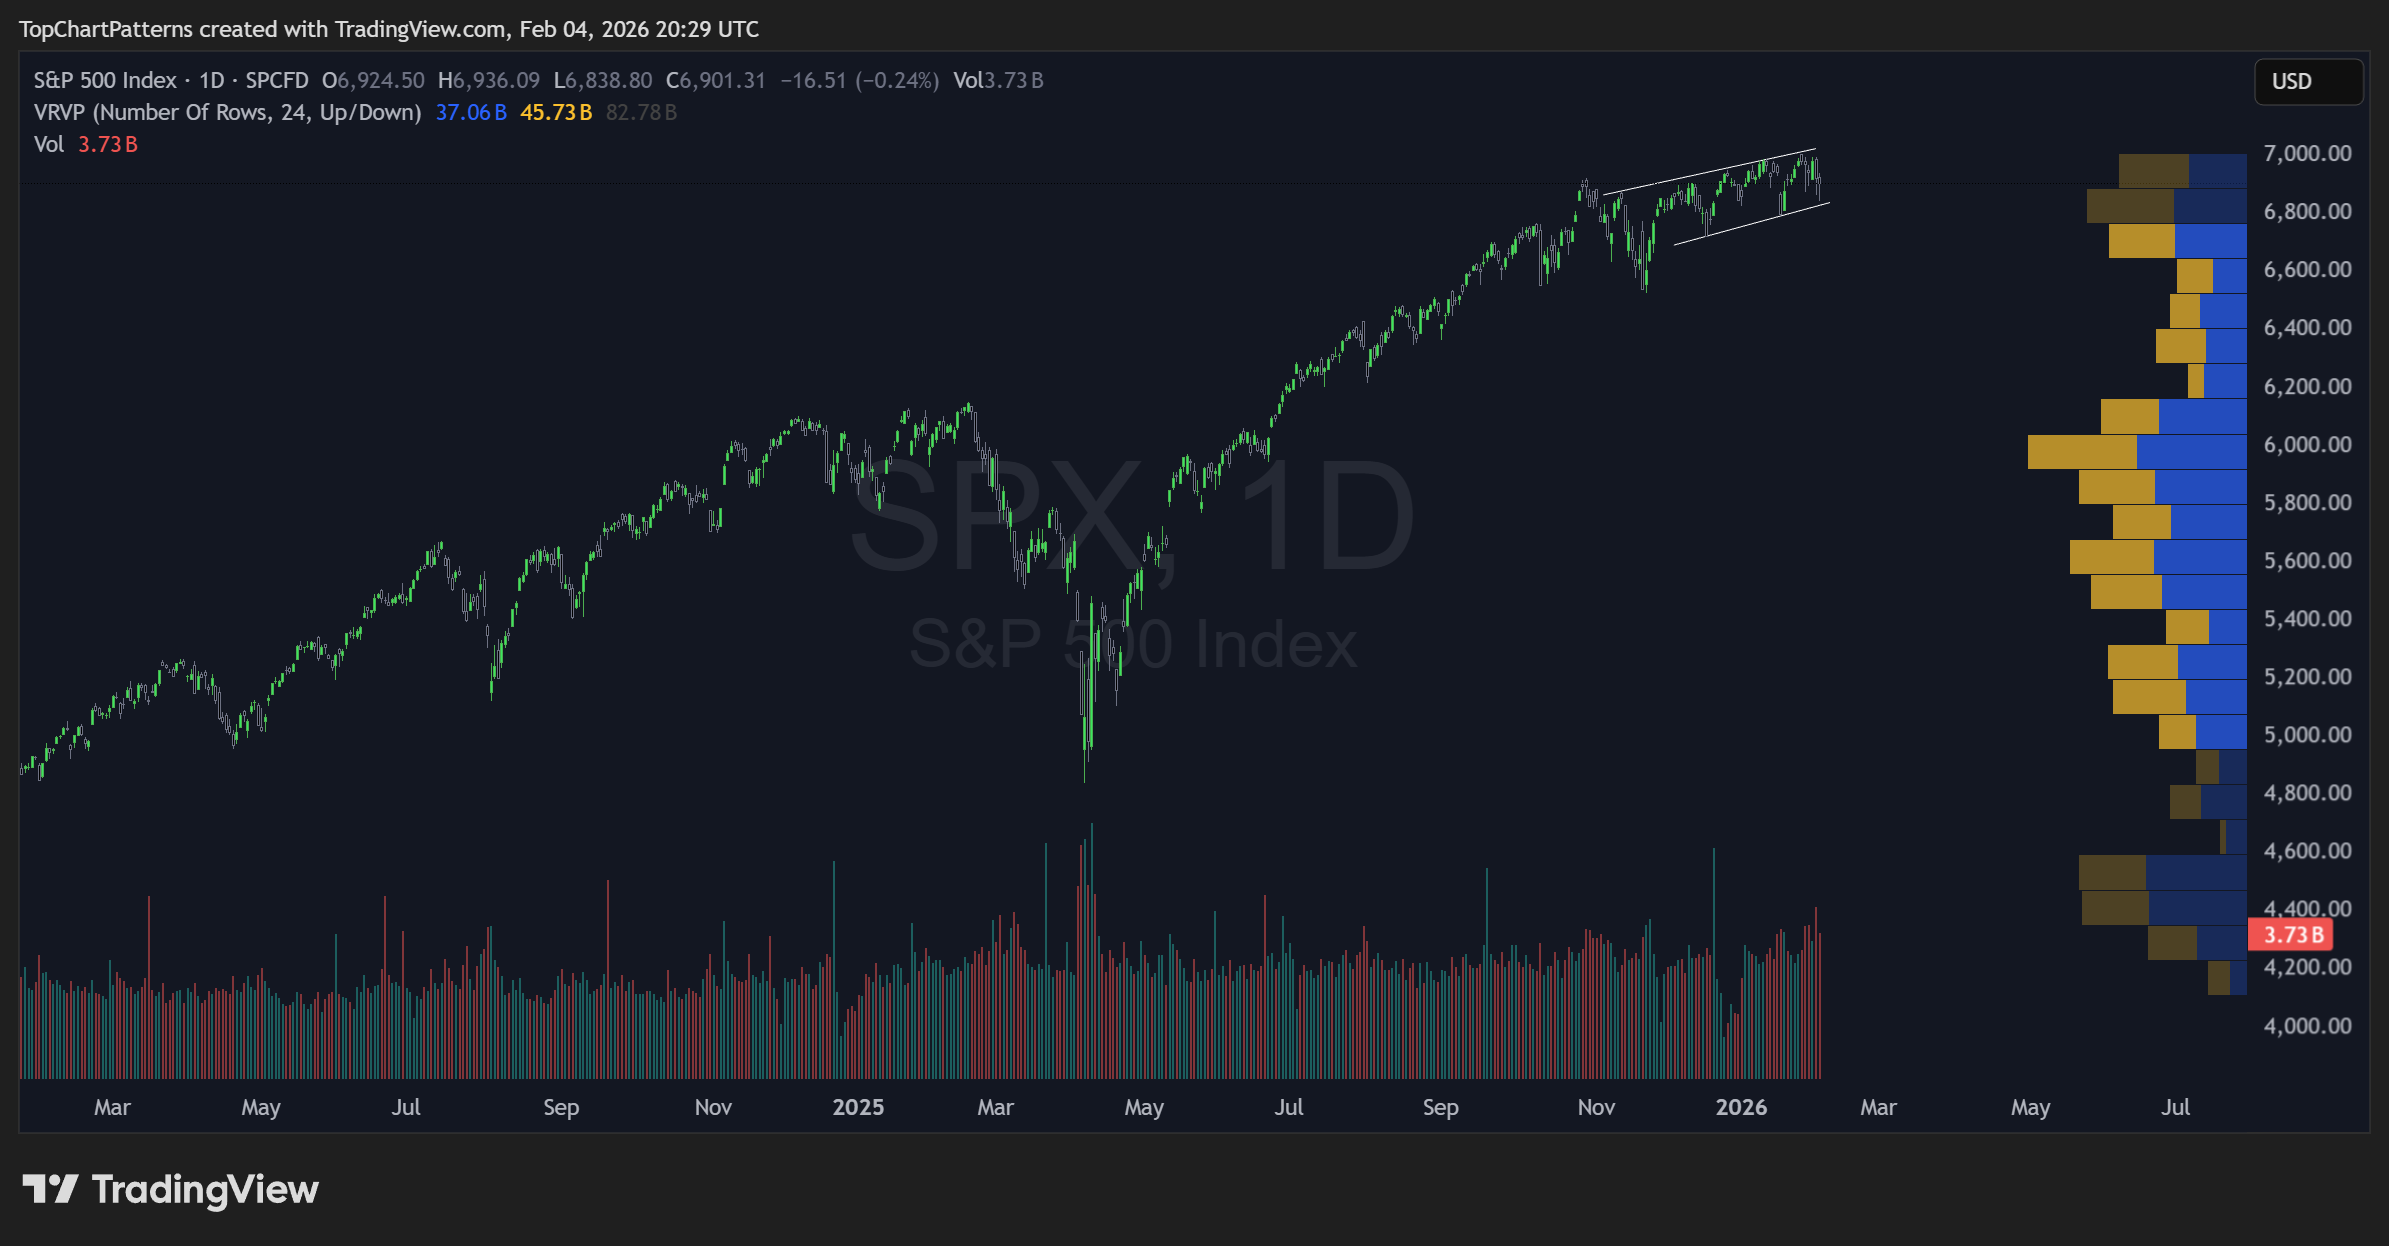
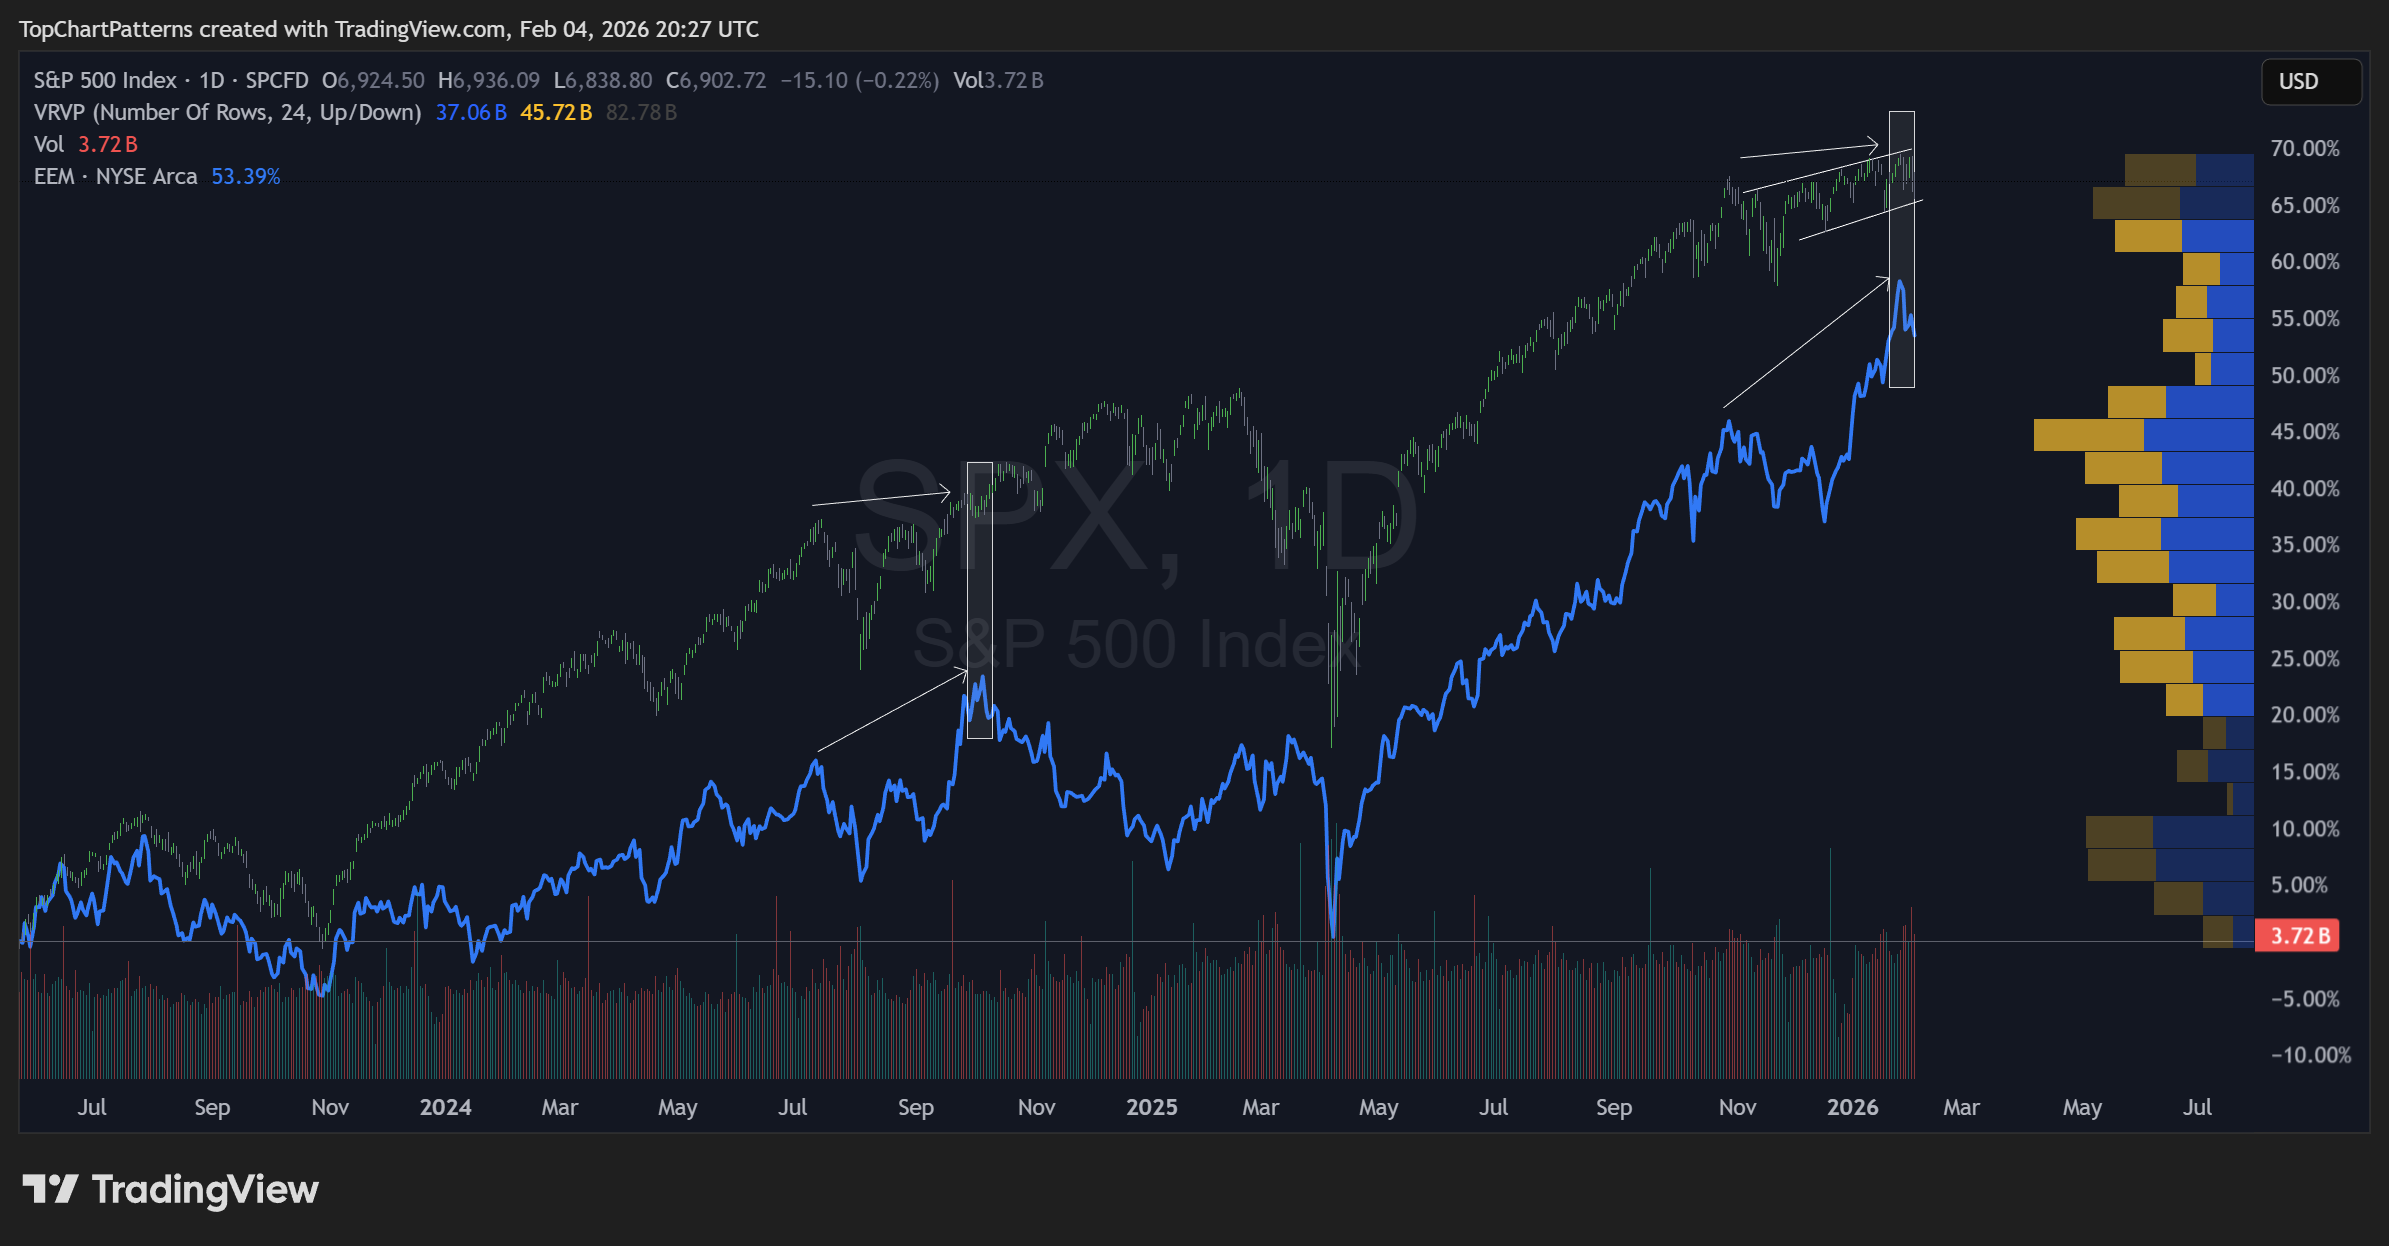
2. SPX 500
Currently, the S&P 500 feels neutral, perhaps dangerously so.
It is showing incredible complacency. I’ll start to sweat if we lose $6,750, and I’ll be truly worried if we hit $6,500.
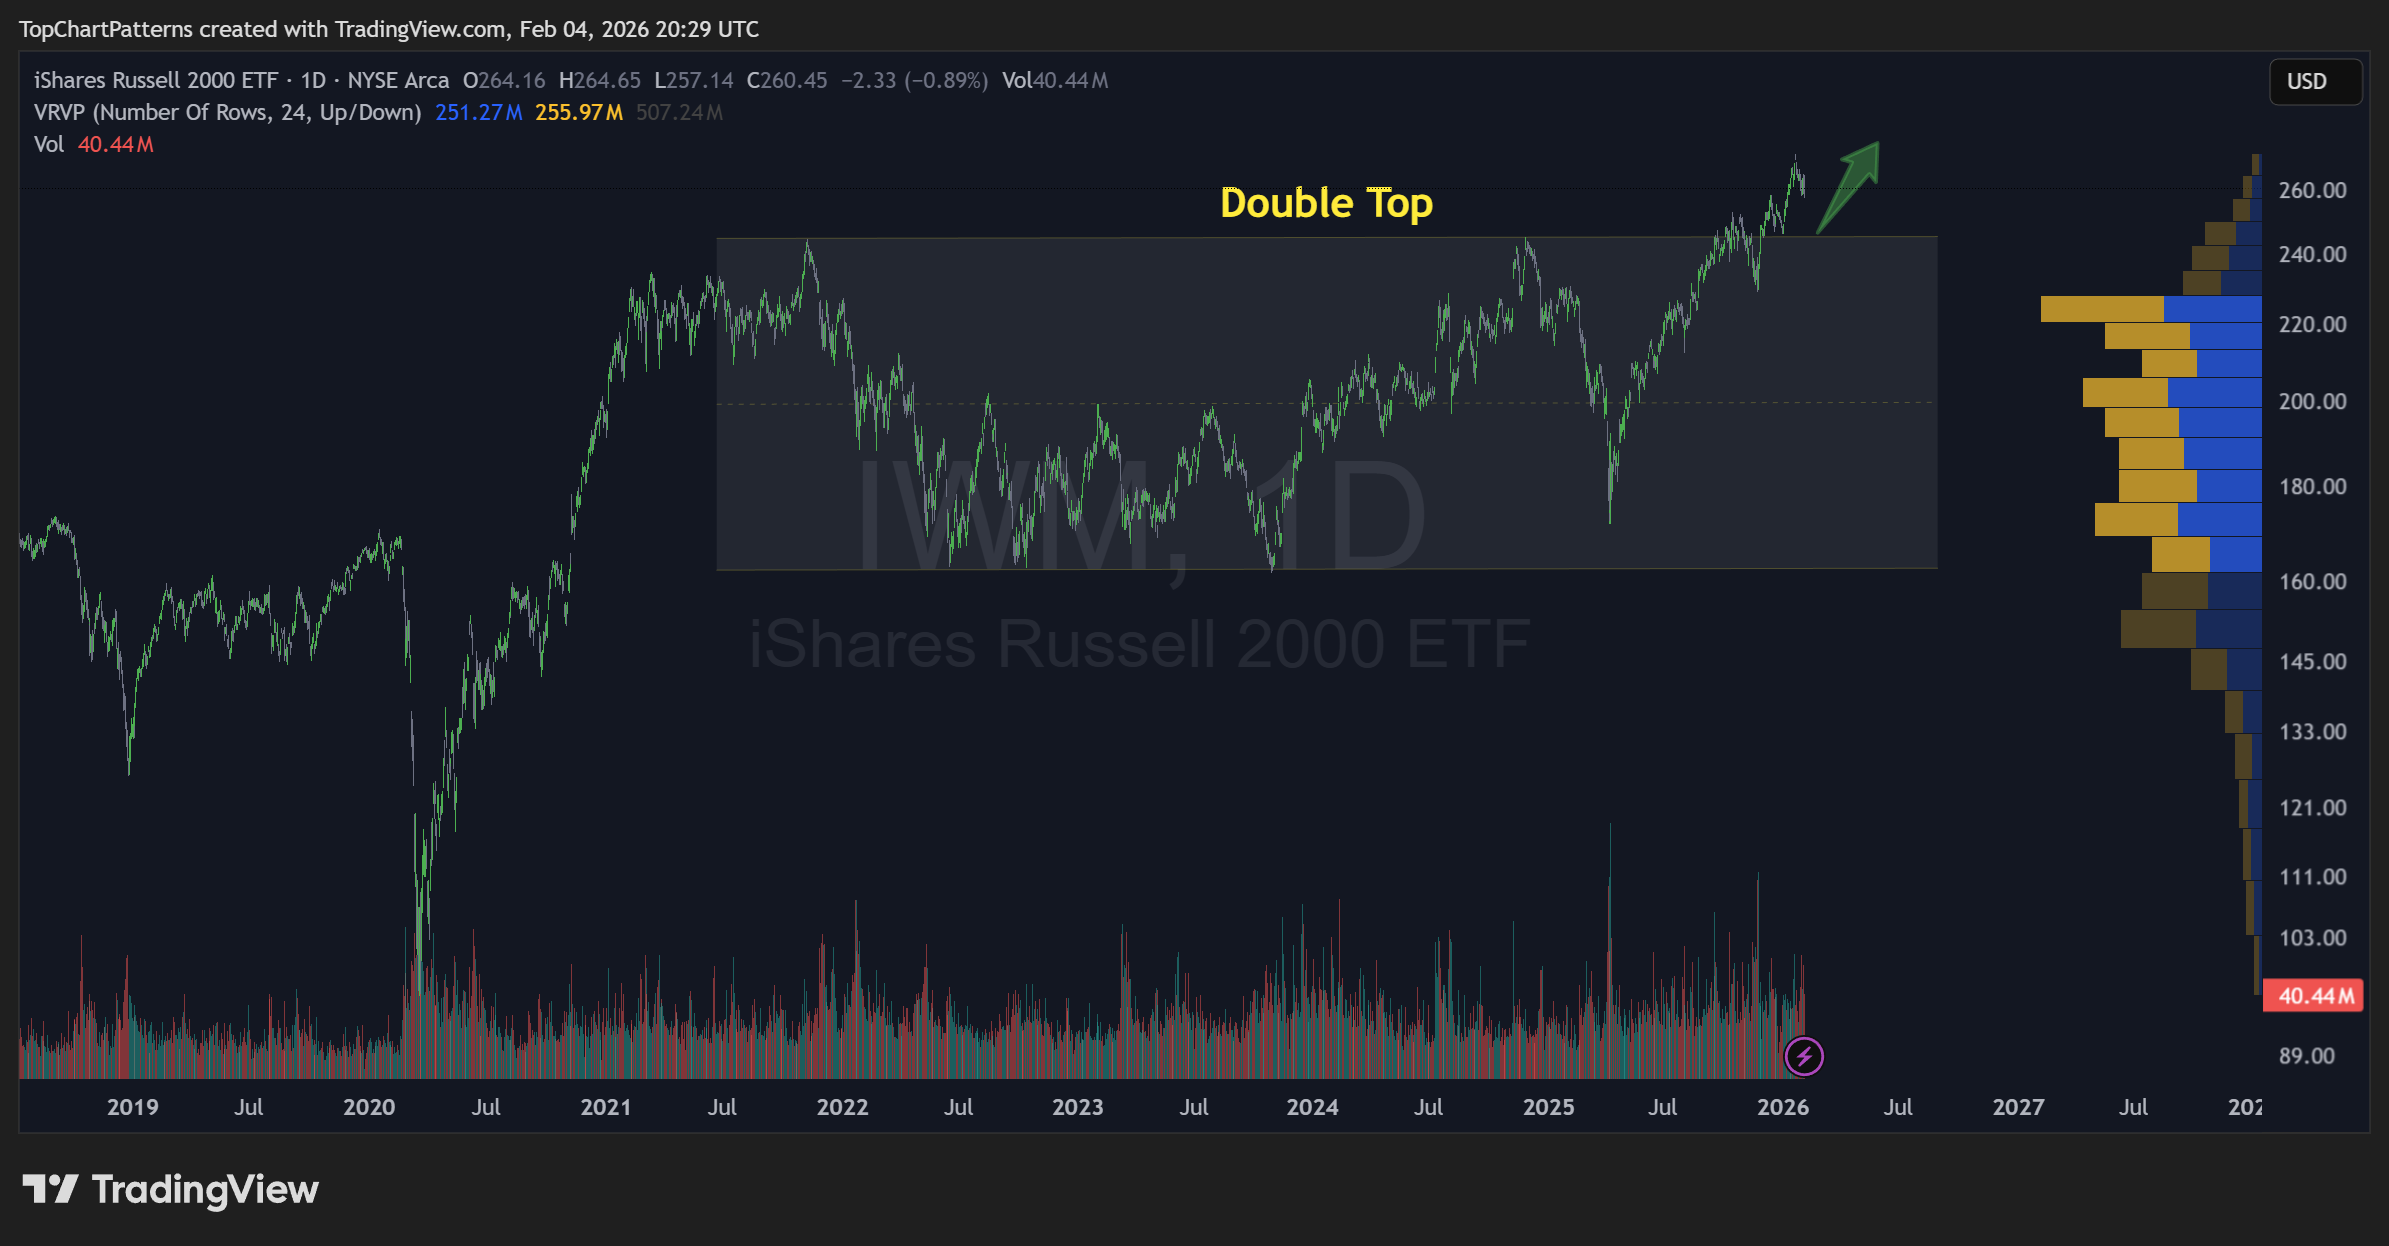
3. Russell 2000 (IWM)
Following its recent double top breakout, this is my favorite index right now alongside the DJI.
It is clearly bullish.
As long as the IWM stays above the breakout level ($230), I’m at peace. While I don’t expect it to lose $250, any volatility there should be viewed as a buying opportunity.
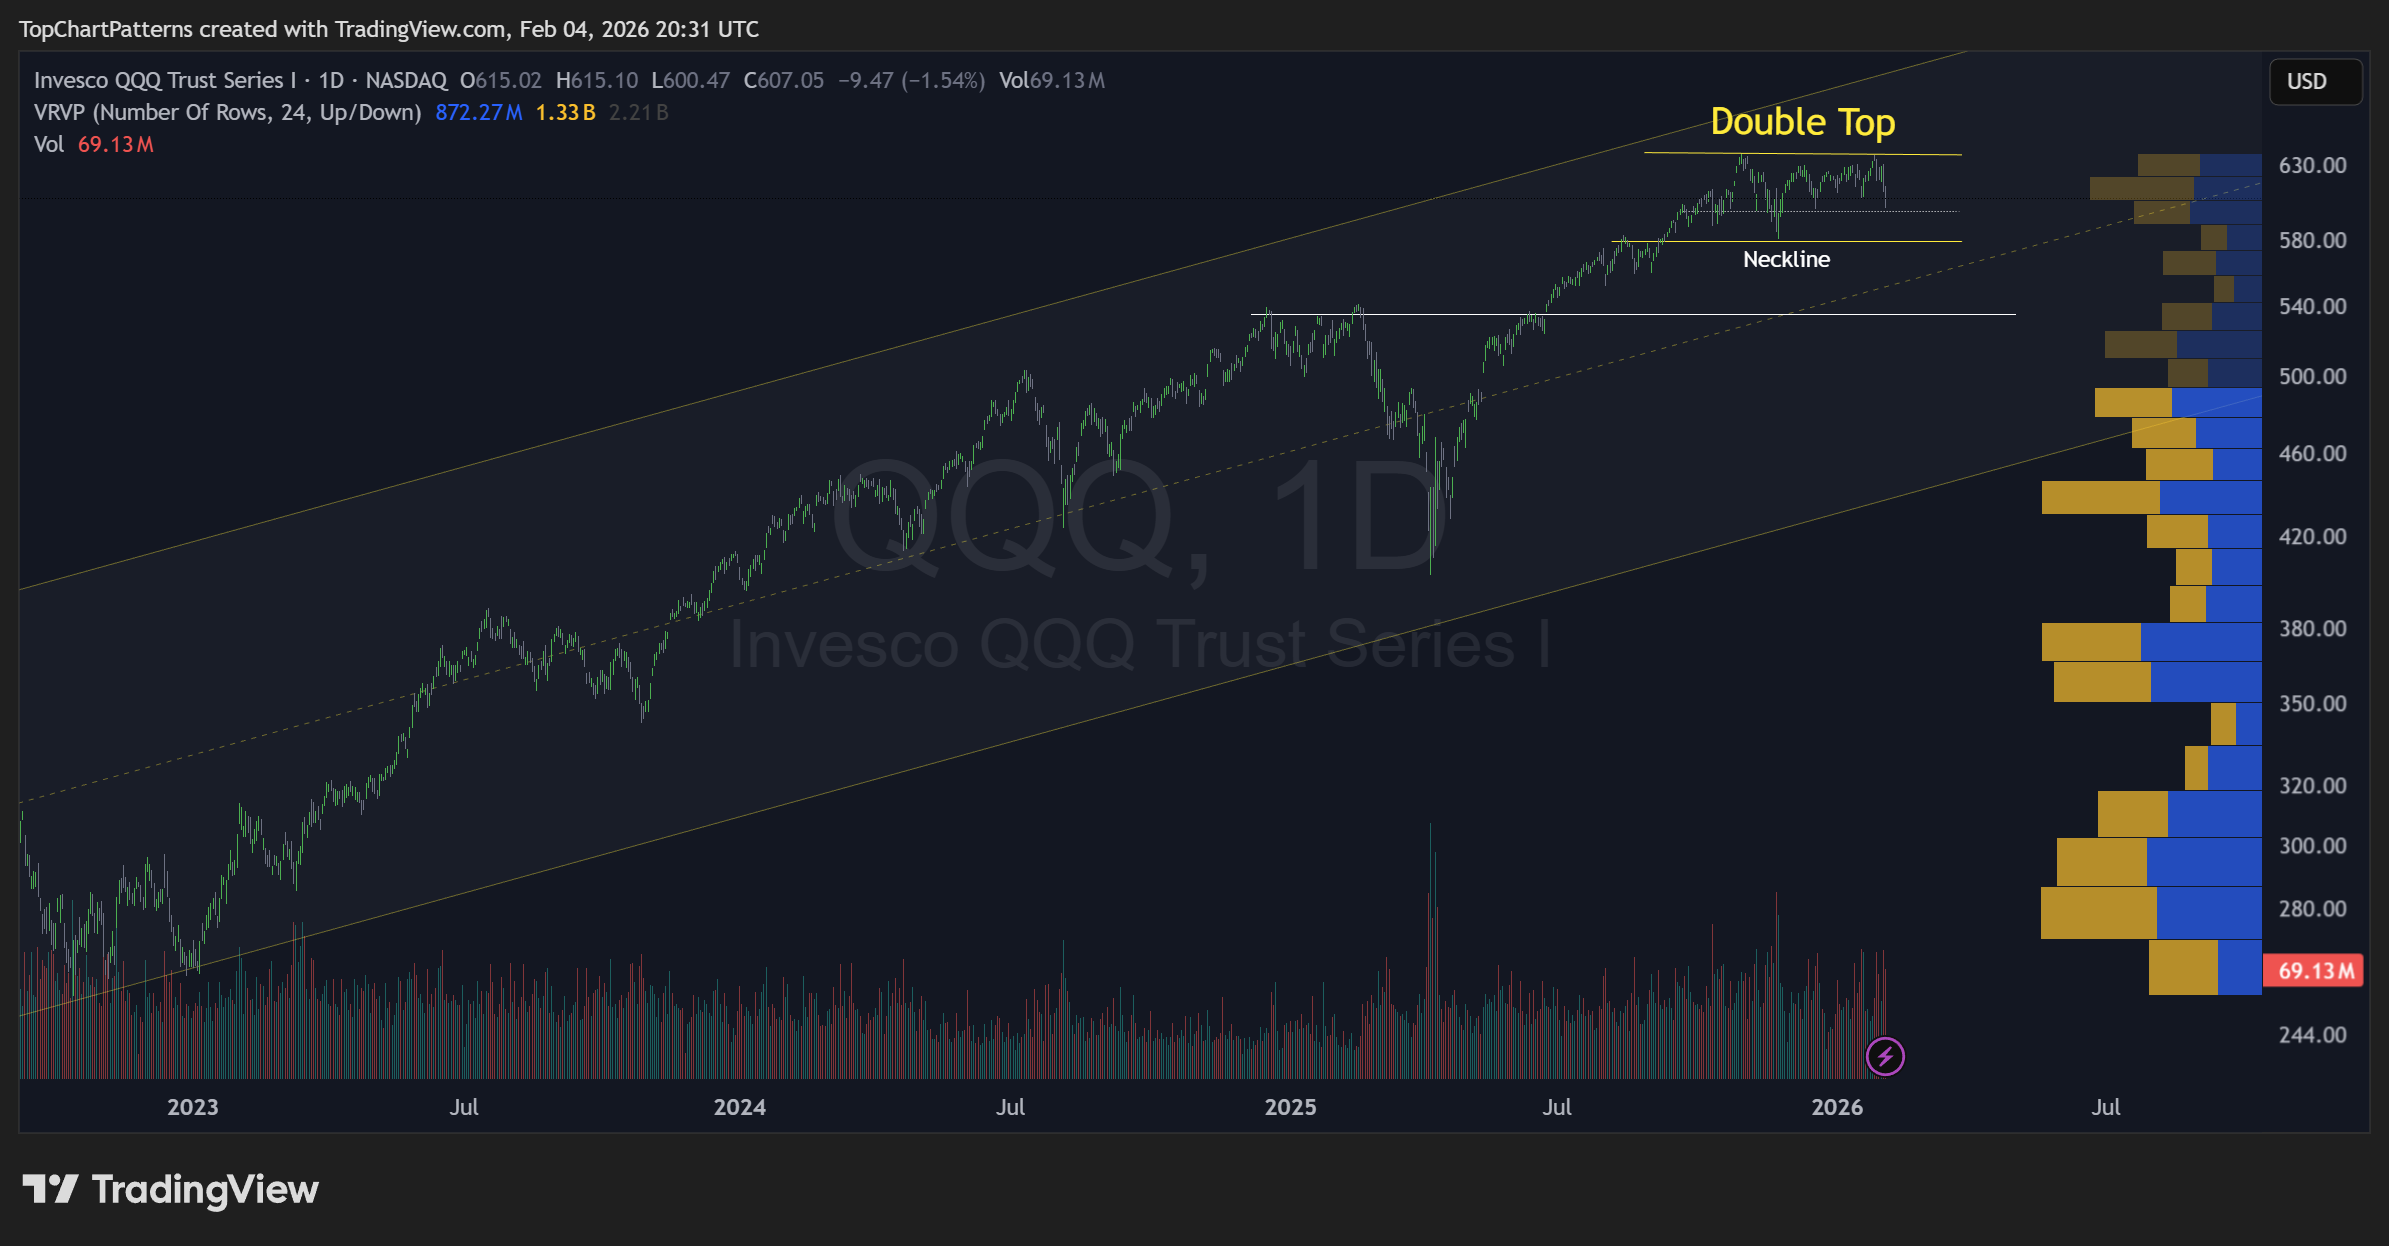
4. Nasdaq 100 (QQQ)
The “crown jewel” is showing cracks.
While the index itself is resilient, it has formed a textbook double top. The last time we saw this pattern, the market corrected 25% in weeks. We are in a “tense calm” between $24k and $26k. Everyone is sitting tight, waiting for someone else to blink first.
The bearish thesis only triggers if we see a sustained break of the Double Top's base. Until then, the trend is still our friend.
Global Perspectives: Europe and Asia
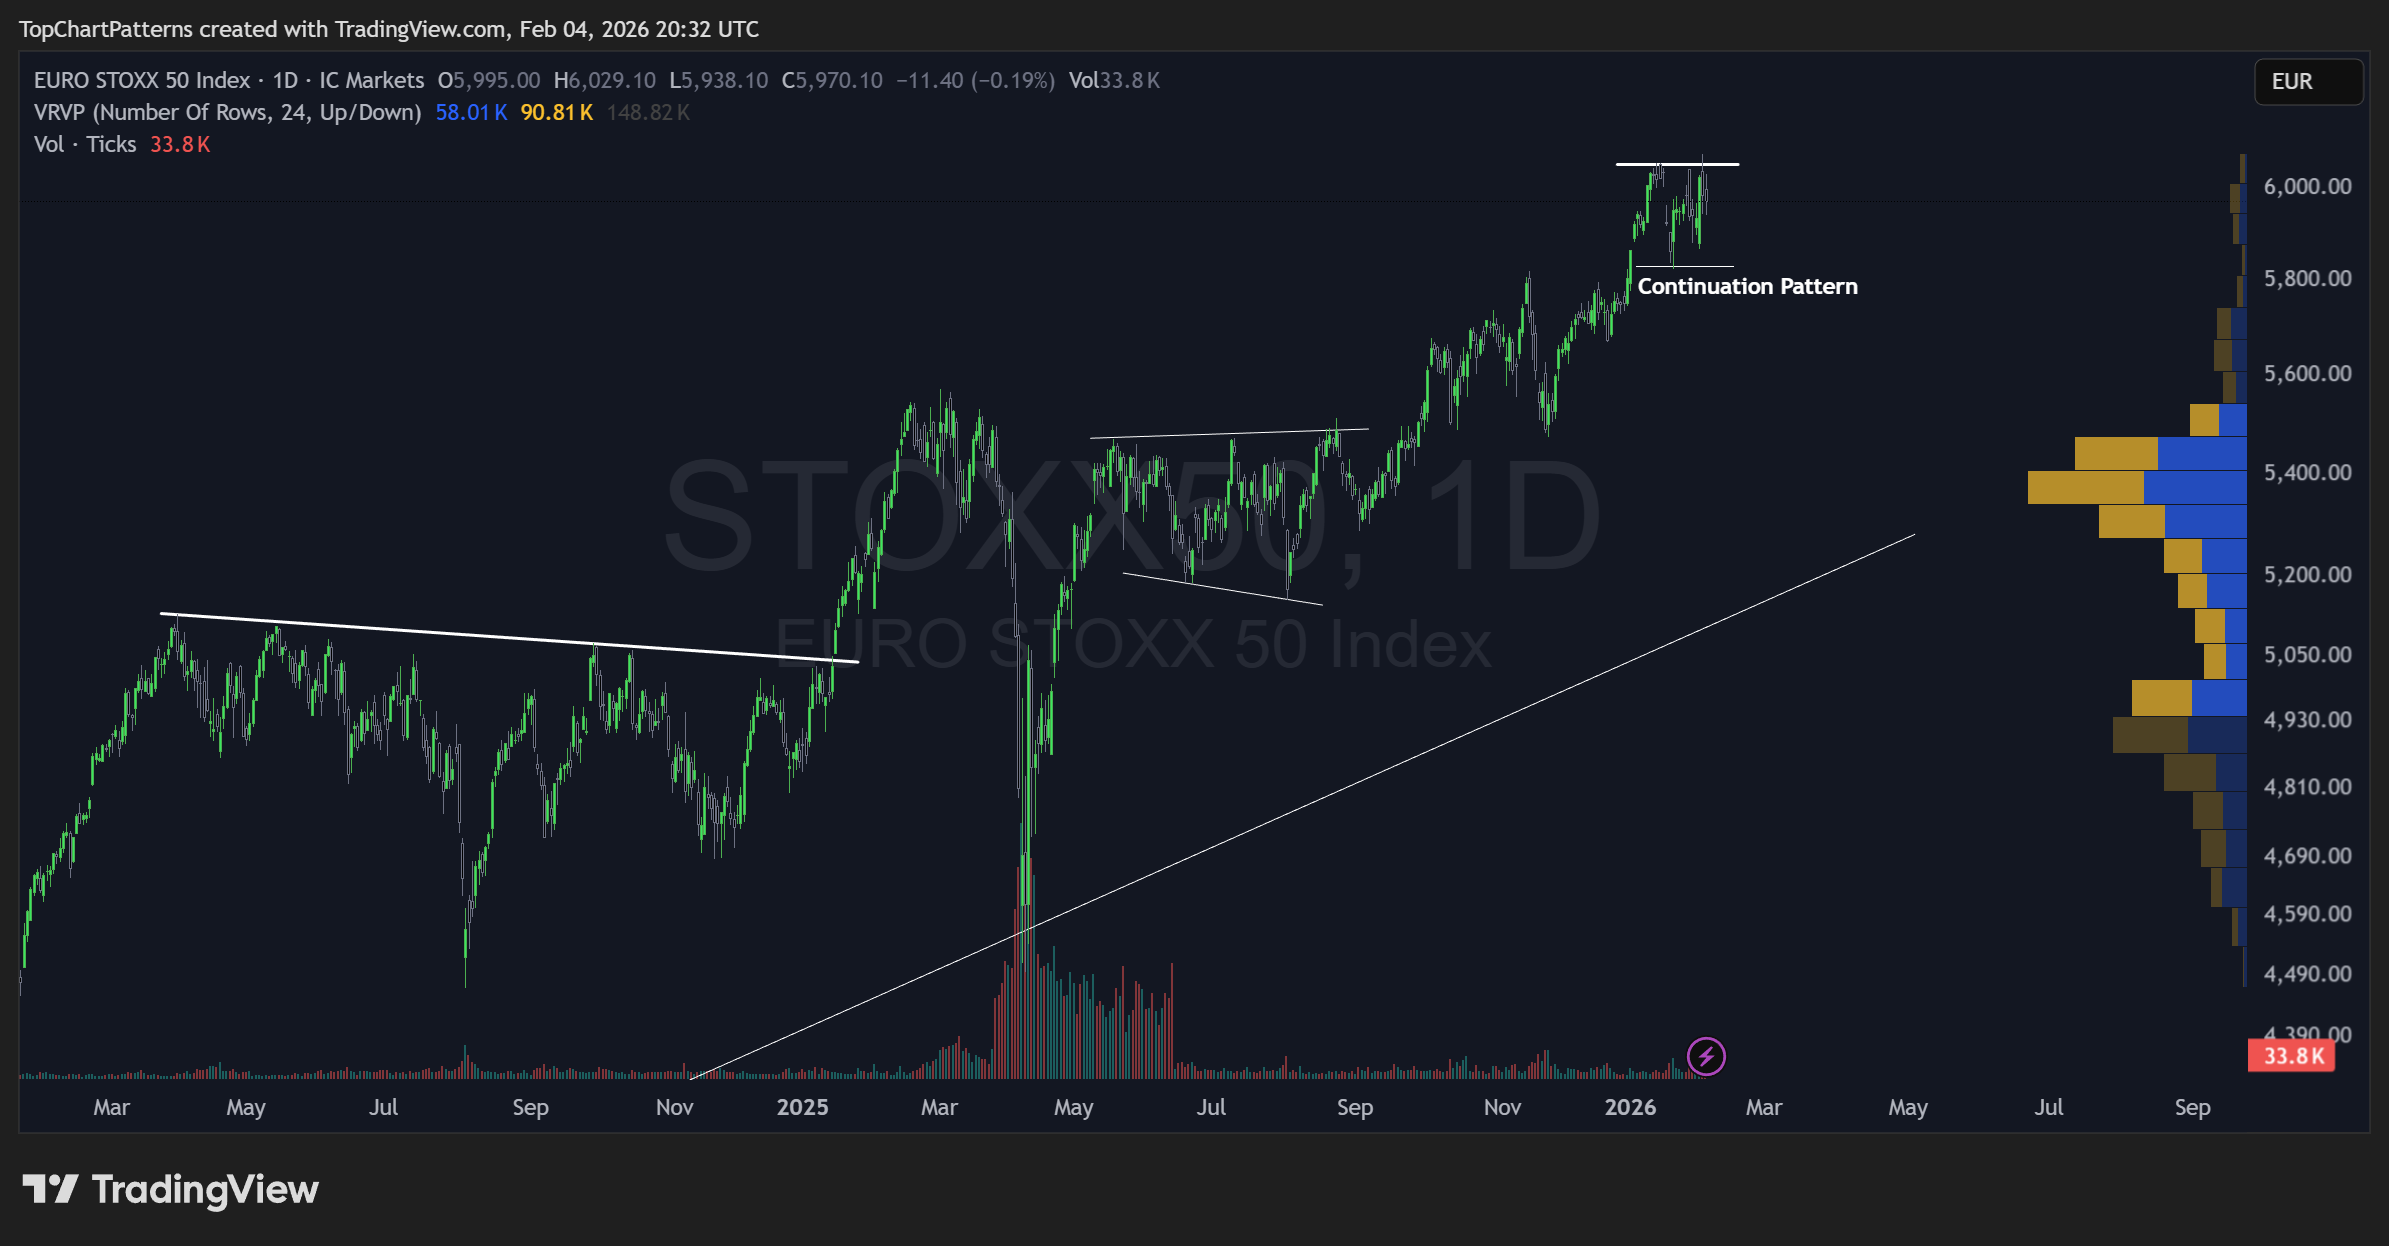
1. Stoxx 50 (Europe)
It’s in a “breather” phase. Losing €5,800 would be concerning, but the trend points toward new highs unless the macro environment sours.
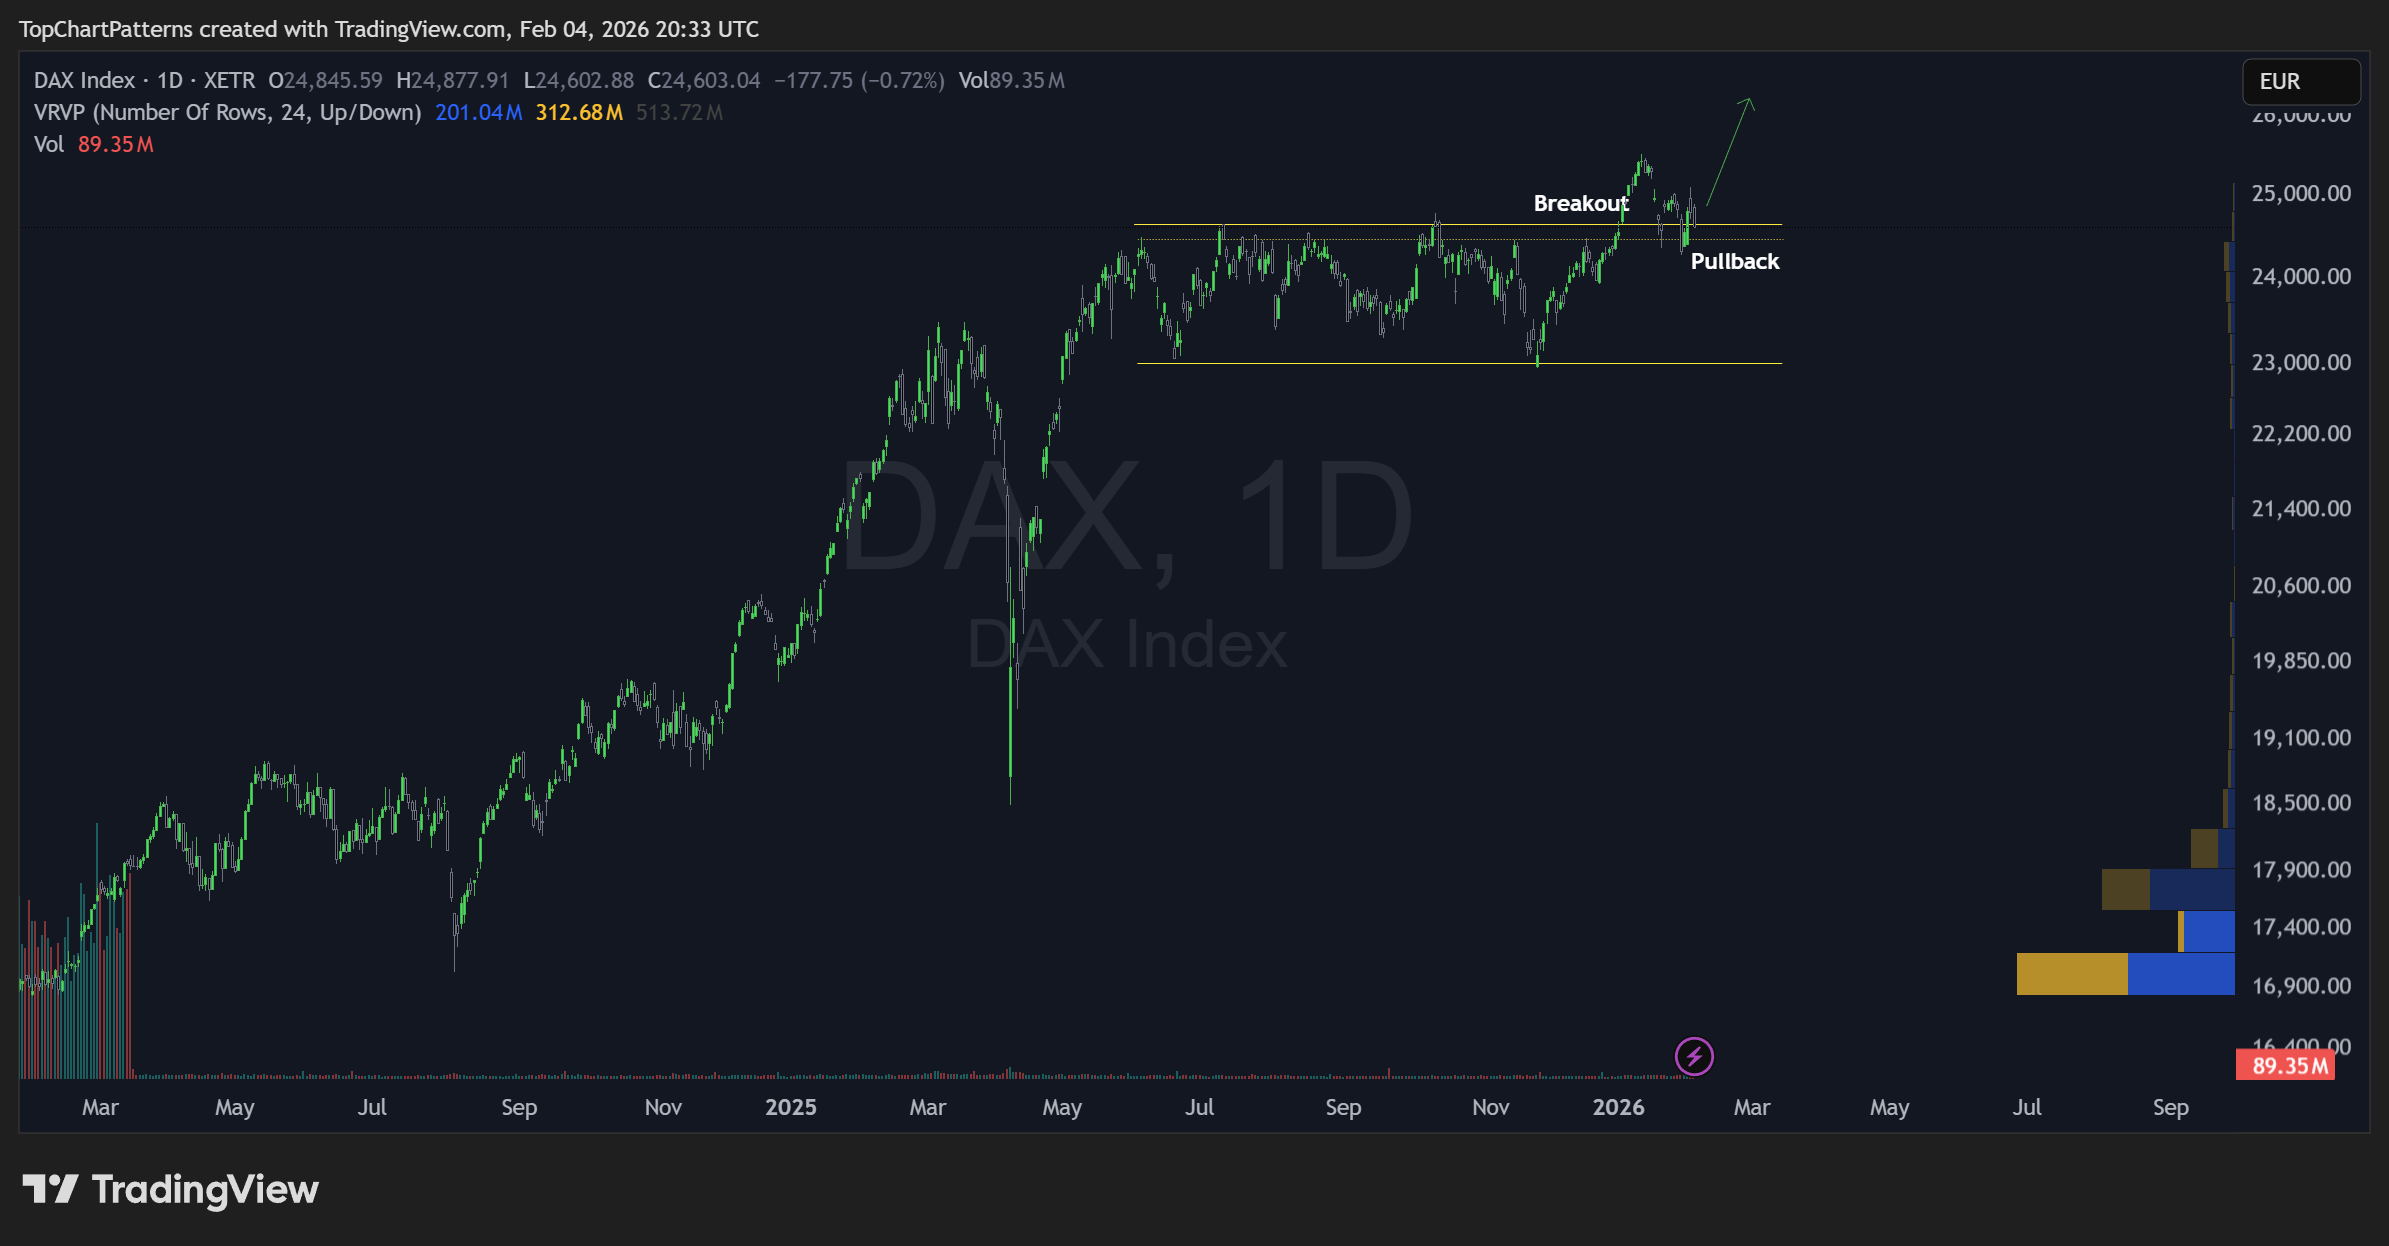
2. DAX (Germany)
Stimulus is working. Like the Russell 2000, it broke a double top to the upside and is currently riding a wave of bullish momentum.
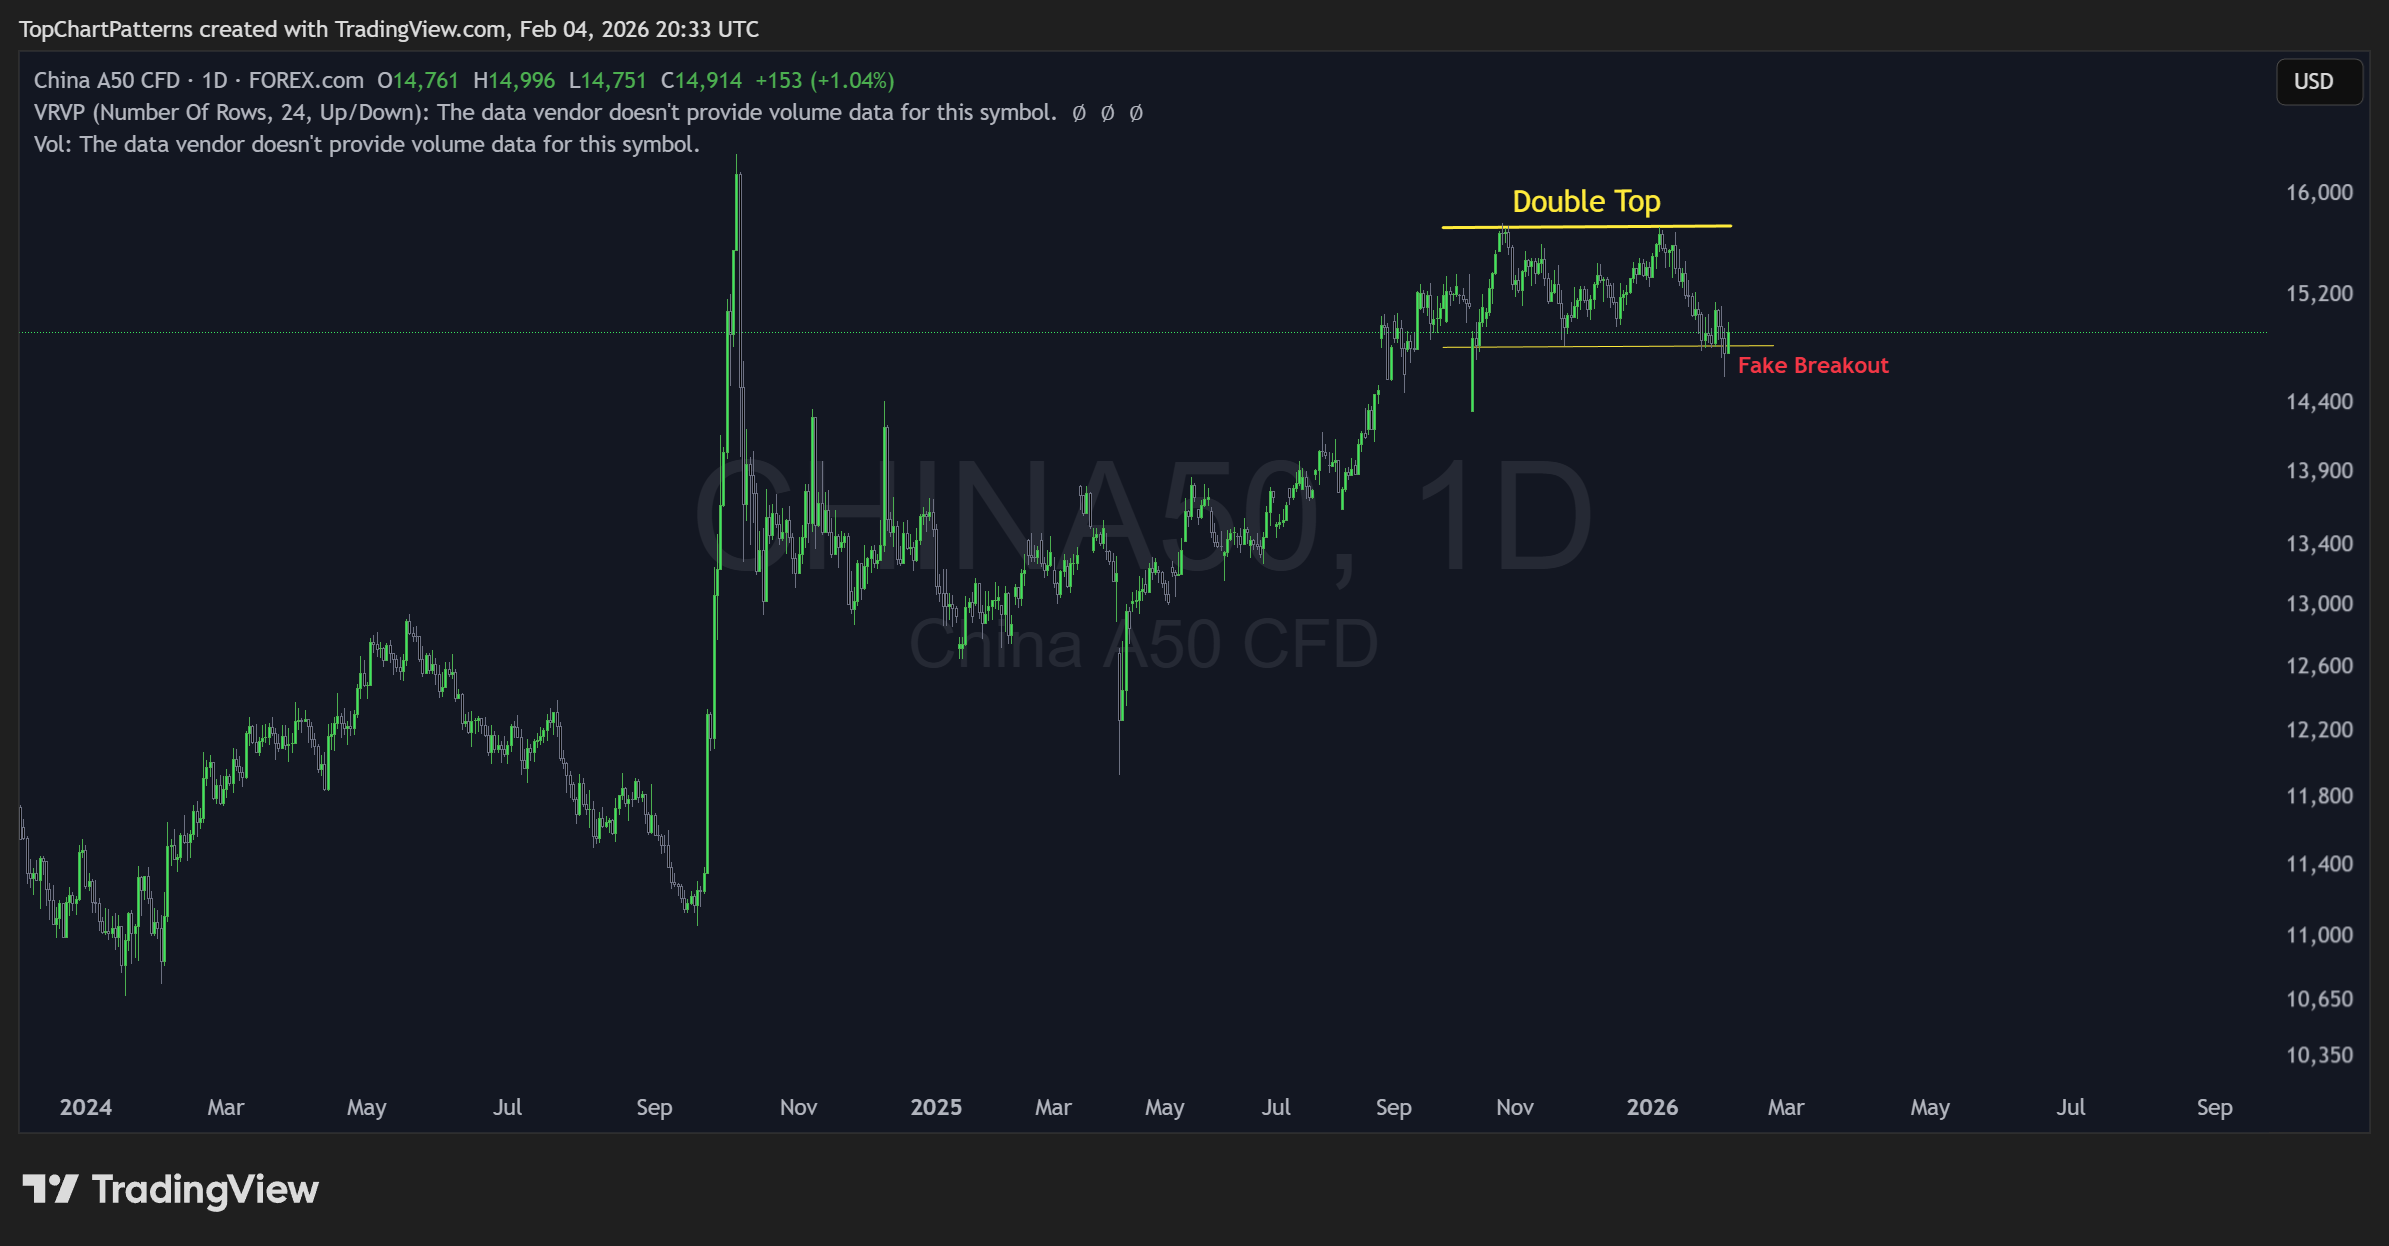
A50 (China)
We saw a scary downside break of a double top, but it recovered in a single day. If this is a fake breakout, it’s actually a very bullish signal. Keep your eyes on China.
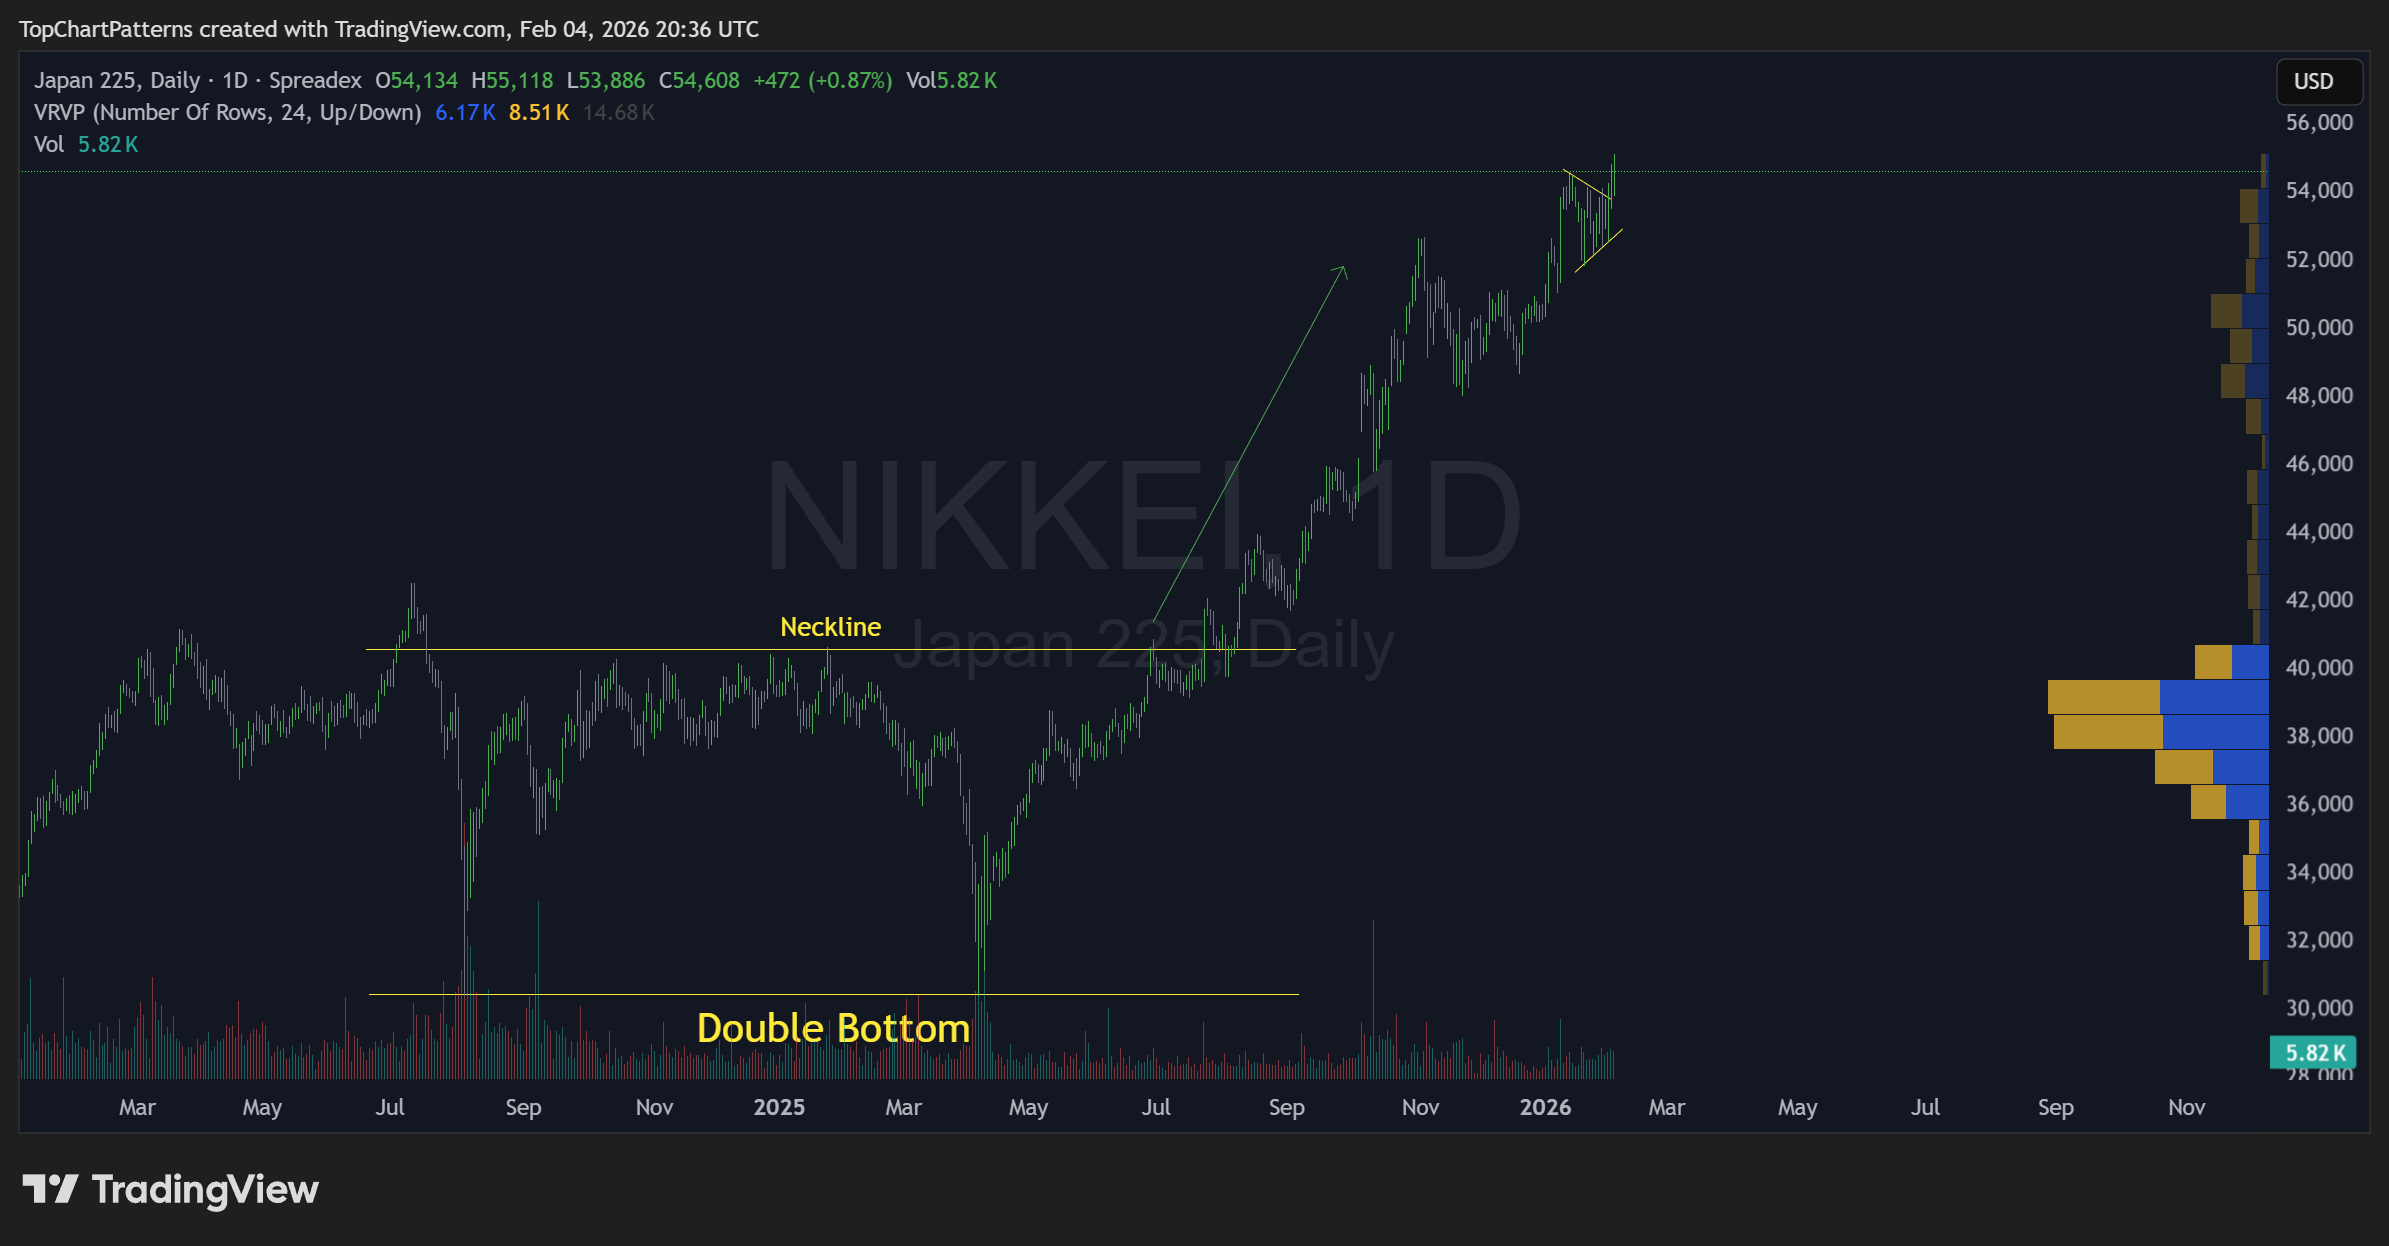
Nikkei 225 (Japan)
After a double bottom, the “easy money” has been made. It’s still in a bullish channel, but the 51,500 level is the key to the castle.
Emerging Markets as an Early Alert
We recently discussed using the Emerging Markets Index (EEM) to predict an SPX drop.
Currently, they remain aligned, but there’s a shadow on the wall: EEM has started to fall with force. This feels like October 2024, where SPX rose weakly after a major EEM rally.
Eventually, SPX continued for a while until a divergence formed. We aren’t at the cliff’s edge yet, but the signals are starting to blink yellow.
The Great Rotation: Moving Away from the Mag7
We often think the US market is the “Magnificent 7,” but the internals are shifting:
AAPL: Down 15%, though nearly recovered.
MSFT: Down 25% from its highs 4 months ago.
META: Suffered a 25% drop, now halfway back.
GOOG: Still in a league of its own, clearly bullish.
AMZN/TSLA: Flat and volatile.
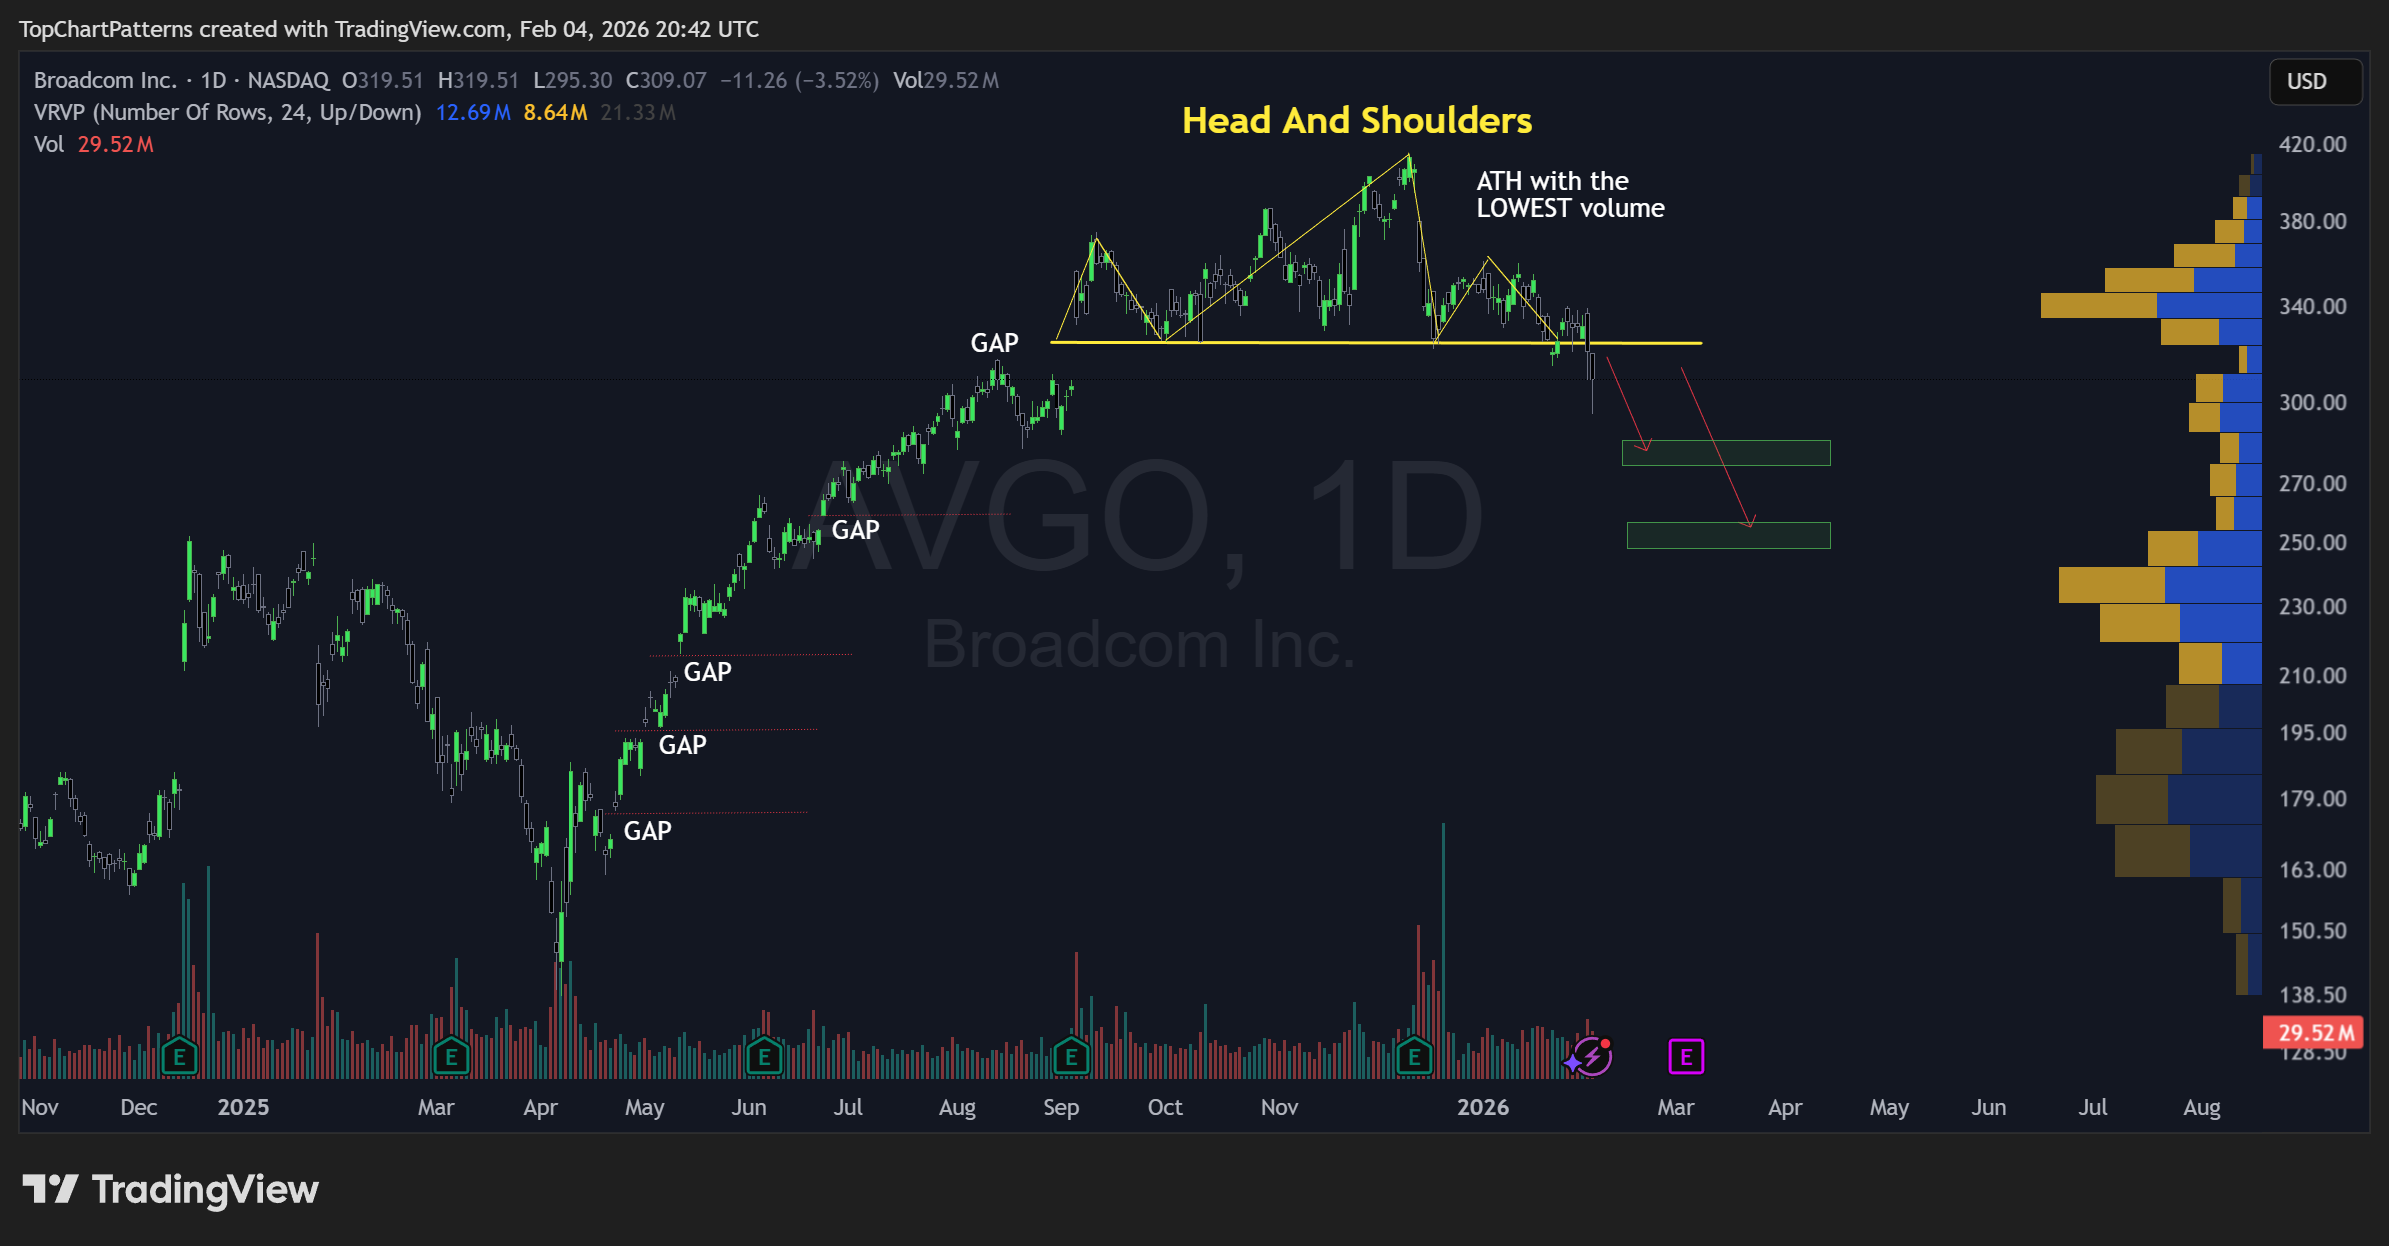
NVDA: The ultimate indicator. It hasn’t fallen... yet. The head and shoulders is almost there.
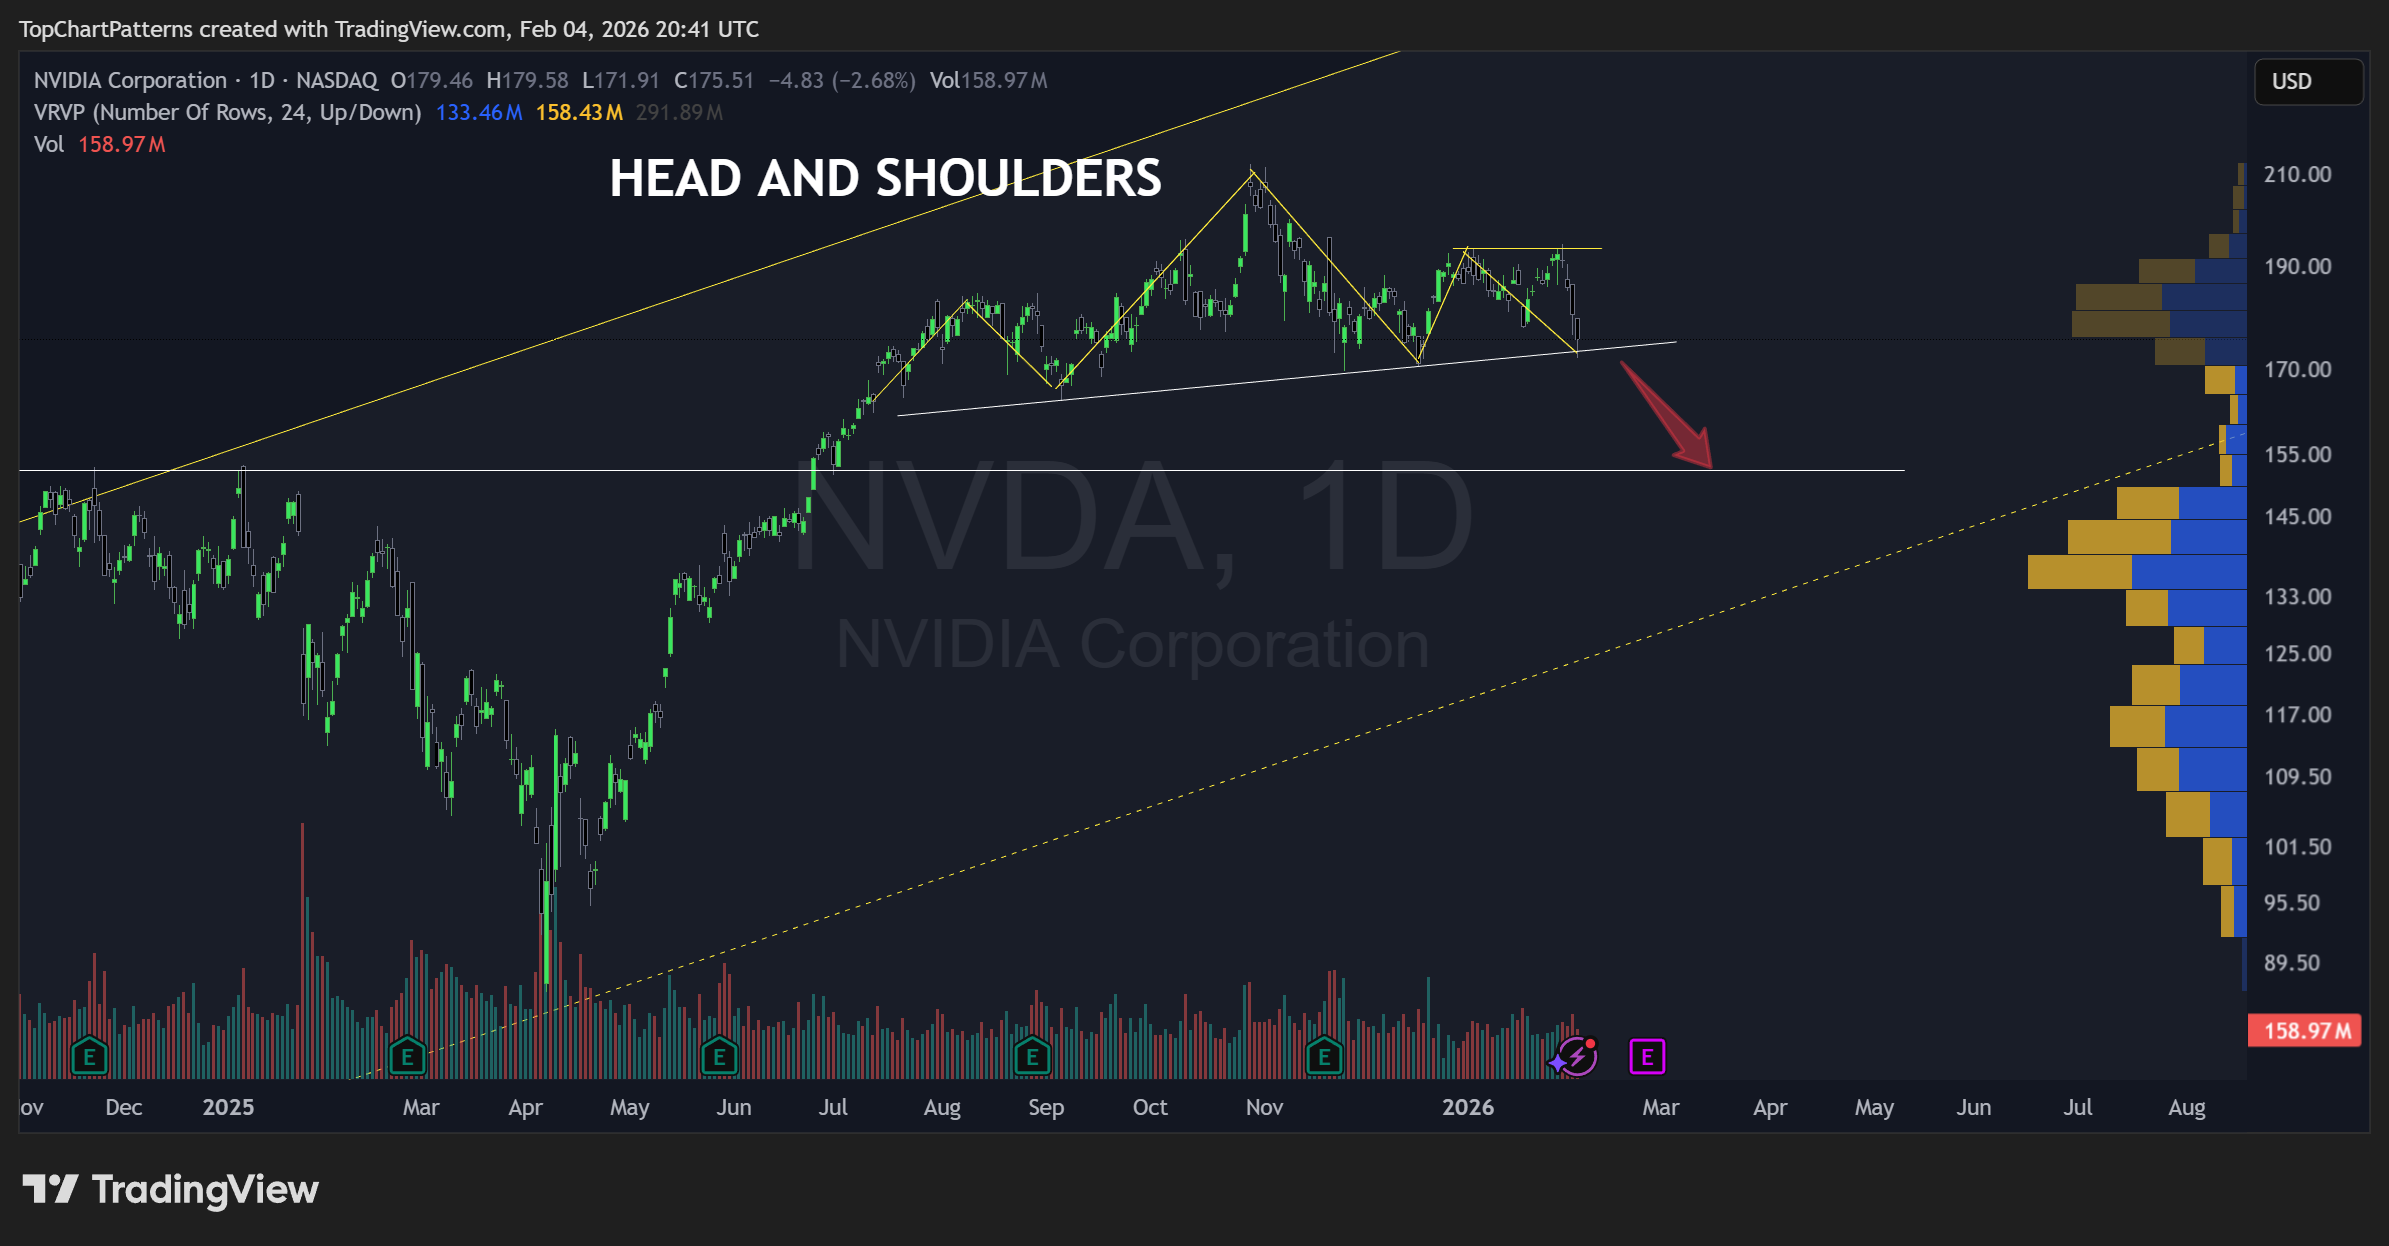
And AVGO just broke one this week… Maybe an early alert for NVDA?
We are witnesing a massive rotation. Money is leaving the Mag7 and flowing into “smaller” companies and the Russell 2000 (which has already yielded 10% in just a few weeks). I think this is very healthy for the market and will help to sustain the bull trend overall.
Summary: The Exit Checklist
We are still in a bull market.
I will only consider an exit if these levels are broken:
Nasdaq 100 → $23,900
SPX 500 → $6,750
Dow Jones → $48,200
The Black Swan?
Will global complacency continue, or will we be blindsided?
My personal fear: a crypto sell-off. If BTC hits unsustainable levels, forced liquidations from major holders (like MSTR) could spill over into the equity markets as they sell stocks to cover their crypto margin calls.
What about you? Do you think the rotation into Small Caps will save the rally, or is the crypto “leverage bomb” about to go off?
Found value here? Smart traders share smart content :)